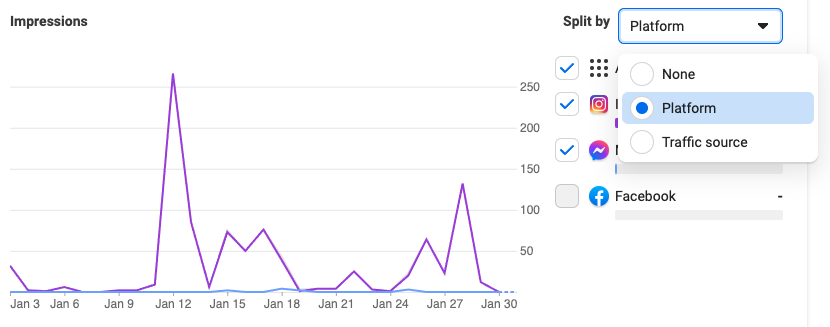
Meta has become one of the most powerful tools for businesses to reach their audience, but running successful campaigns isn’t just about setting up ads. To truly make an impact, understanding how your ads perform and how your audience engages with them is key. This is where Meta Analytics comes in—it allows businesses to dive deeper into the numbers, uncover trends, and make smarter decisions to improve results.
In this blog post, we’ll explore why analyzing your Meta campaigns is essential for optimizing performance and driving meaningful growth.
What is Meta Analytics?
Meta Analytics is a powerful tool designed to provide detailed insights into how users interact with your business across Facebook and other connected platforms. It tracks key metrics such as user behaviour, campaign performance, audience demographics, and engagement trends.
By analyzing this data, you can identify what resonates with your audience, uncover patterns, and measure the effectiveness of their marketing strategies.
Unlike basic metrics like likes or shares, Meta Ads Analytics dives deeper into the customer journey, offering a holistic view of touch points—from ad interactions to conversions. This enables businesses to make informed, data-driven decisions that optimize campaigns, enhance user experiences, and ultimately boost return on investment.
Why is Meta Analytics important?
Meta Ads Analytics is important because it provides businesses with actionable insights that go beyond surface-level metrics like clicks or likes.
By understanding how users interact with your ads, you can make data-driven decisions to optimize your marketing strategies. It helps identify which campaigns drive the most engagement, what resonates with your target audience, and where potential customers drop off in their journey.
This level of detail allows for smarter ad spending, better targeting, and improved customer experiences, ultimately leading to higher conversions and a stronger return on investment.
What does it include?
Meta Ads Analytics offers a wide range of metrics that provide a detailed view of your campaign performance.
By understanding and tracking these key indicators, you can gain valuable insights into how well your ads are resonating with your audience and where there might be room for improvement. Each metric plays a crucial role in measuring different aspects of your customer journey, from initial engagement to final purchase.
Here are the key metrics available in Meta Ads Manager:
- Performance Metrics: Impressions, Reach, Frequency, Clicks, Click-Through Rate (CTR), Results, Cost Per Result
- Engagement Metrics: Post reactions, Comments, Shares, Saves, Engagement Rate
- Video Metrics: Video Views, ThruPay, Average Video Watch Time, Percentage Watched
- Cost Metrics: Cost Per Click (CPC), Cost Per Thousand Impressions (CPM), Cost Per Acquisition (CPA), Cost Per Lead
- Conversion Metrics: Conversions, Conversion Rate, Return on Ad Spend (ROAS), Value Per Conversions
- Traffic Metrics: Landing Page Views, Link Clicks, Cost Per Link Click
- Demographics and Placement Metrics: Audience Breakdown (age, gender, location), Placement Performance (e.g., Instagram, Facebook Feed)
- Attribution Metrics: Attribution Settings (e.g., 7-day click, 1-day view)
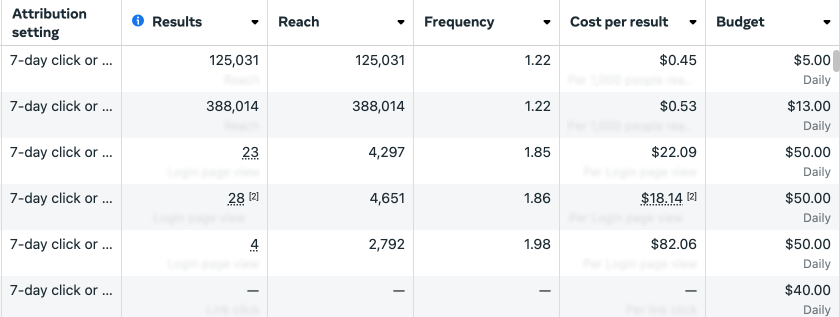
Let’s dive into the basics of Meta advertising and break down the key metrics that matter most for e-commerce success.
Meta Ads Analytics Metrics
The most important Meta Ads metrics depend on your goals, but here are the key ones to track for an e-commerce store:
Impressions
Impressions refer to the total number of times your ad is displayed to users on Meta, regardless of whether they interact with it or not.
This metric provides a high-level view of your ad’s reach and visibility. While impressions alone don’t indicate engagement or success, they are essential for understanding how often your content is being seen.
A higher number of impressions can indicate that your ad is reaching a broad audience, but it’s important to analyze this metric in combination with other indicators like clicks or conversions to gauge the effectiveness of your ad.
Monitoring impressions helps ensure your ad gets the exposure it needs to drive further engagement and ultimately meet your campaign objectives.
Clicks
Clicks represent the total number of times users interact with your ad, whether by clicking on the ad itself, a link, or a call-to-action button.
This metric is a key indicator of engagement, showing how effective your ad is at capturing attention and prompting users to take the next step. While clicks can be a sign of interest, it’s important to view them in context with other metrics, such as conversions or add-to-cart actions, to determine the quality of that engagement.
A high click count typically suggests that your ad content resonates with your audience, but it’s essential to track the journey beyond the click to measure the true success of your campaign.
Purchases
Purchases refers to the total number of completed transactions or sales made as a result of your ad campaigns.
This metric is one of the most direct indicators of an ad’s success, as it reflects the ultimate goal of most advertising efforts—turning interest into actual revenue. Tracking purchases allows you to assess the effectiveness of your ad strategy in driving conversions and achieving your sales objectives.
A higher number of purchases suggests that your ads are successfully resonating with your audience and motivating them to take action.
However, it’s important to analyze this metric alongside others, such as conversion rate and ROAS, to evaluate the overall efficiency and profitability of your campaigns.
Conversion Value
Conversion Value represents the total monetary value generated from the conversions (purchases) driven by your ads.
This metric helps you understand the financial impact of your campaigns by calculating the revenue that can be attributed to the actions users take after engaging with your ad.
Conversion value is especially useful for businesses that rely on direct sales, as it provides a clear picture of how much return you’re getting from your ad spend.
By tracking this metric, you can assess the effectiveness of your campaigns not just in terms of volume (purchases), but also in terms of the quality and profitability of those sales. It’s a key factor in calculating ROAS and optimizing campaigns to maximize revenue.
Spend
Spend is the total amount spent on your Meta ads campaigns during a specific period. This metric is essential for tracking your advertising budget and understanding how much you’re investing in reaching your target audience.
Monitoring your spend helps you ensure that you’re staying within your allocated budget while also evaluating the cost-efficiency of your campaigns.
By comparing spend with other metrics like purchases or conversion value, you can assess the effectiveness of your advertising budget and make adjustments to optimize your return on investment.
Efficient spend management is crucial for scaling your campaigns and maximizing the impact of your marketing dollars.
CTR or Click-Through Rate
CTR (Click-Through Rate) is the percentage of people who click on your ad after seeing it. It is calculated by dividing the number of clicks by the number of impressions, then multiplying by 100.
This metric is a key indicator of how compelling and relevant your ad is to your audience. A higher CTR suggests that your ad is engaging and successfully capturing the attention of users, prompting them to take action.
Tracking CTR allows you to assess the effectiveness of your ad copy, visuals, and targeting strategy. While a high CTR is positive, it should be analyzed alongside other metrics like conversions to ensure that the clicks are leading to meaningful outcomes.
CPM or Cost per Mille
CPM (Cost per Thousand Impressions) represents the cost of reaching 1,000 people with your ad.
It’s calculated by dividing the total spend by the number of impressions, then multiplying by 1,000. This metric is often used to measure the cost-efficiency of a campaign in terms of exposure.
A lower CPM means you’re able to reach a larger audience for less money, while a higher CPM could indicate that your ads are targeting a more competitive or specific audience.
Tracking CPM helps you gauge the effectiveness of your ad placement and budget allocation, and can be especially useful when running brand awareness campaigns where the goal is to maximize visibility.
However, it’s important to pair CPM with other metrics like CTR and conversion rates to get a fuller picture of campaign performance.
CPC or Cost per Click
CPC (Cost per Click) measures the cost you pay for each click on your ad. It’s calculated by dividing the total spend by the number of clicks.
This metric is crucial for understanding how cost-effective your ad is in driving user engagement. A lower CPC suggests that you’re getting clicks for a relatively low cost, which can be a sign of efficient targeting and compelling ad content.
On the other hand, a high CPC may indicate that your ads are in a competitive space or that your targeting needs optimization.
Monitoring CPC helps you manage your advertising budget and assess how well your campaigns are generating clicks in relation to your investment. It’s important to balance CPC with conversion-related metrics to ensure that clicks are not only cheap but also valuable.
CAC or Customer Aquisition Cost
CAC (Customer Acquisition Cost) represents the total cost of acquiring a new customer through your ad campaigns.
It is calculated by dividing the total spend by the number of new customers gained. This metric is crucial for assessing the efficiency of your marketing efforts in turning leads into paying customers.
A lower CAC means that you are acquiring customers at a lower cost, which is ideal for maximizing profitability. Conversely, a high CAC could signal that your marketing strategies or targeting need adjustments to reduce expenses.
Tracking CAC helps you understand the financial viability of your campaigns and ensures that your customer acquisition efforts are sustainable and cost-effective in the long term.
ROAS or Return on Ad Spend
ROAS (Return on Ad Spend) is a metric that measures the total revenue generated for every dollar spent on ads.
It is calculated by dividing the total conversion value (revenue) by the total ad spend. For example, a ROAS of 4 means you earned $4 for every $1 spent on advertising.
This metric is crucial for evaluating the profitability and effectiveness of your campaigns. A higher ROAS indicates that your ad campaigns are generating strong returns, while a low ROAS suggests that the campaigns may not be yielding enough revenue to justify the investment.
Tracking ROAS helps you optimize your budget allocation, adjust targeting strategies, and focus on high-performing ads to maximize profitability.
AOV or Average Order Value
AOV (Average Order Value) measures the average amount of money spent per order on your website or store.
It is calculated by dividing the total revenue by the number of orders. This metric helps businesses understand how much customers typically spend when making a purchase, allowing for better pricing strategies and upselling opportunities.
A higher AOV indicates that customers are purchasing more or higher-priced items, while a lower AOV may signal that customers are buying smaller quantities or lower-value products.
Tracking AOV can guide your marketing efforts, helping you create campaigns that encourage larger purchases or increase the value of each transaction.
Add to Cart Rate
Add to Cart Rate measures the percentage of users who add items to their shopping cart after interacting with your ad.
It is calculated by dividing the number of “Add to Cart” actions by the number of ad clicks, then multiplying by 100. This metric is important for understanding how effective your ad is at driving potential customers to take the next step in the purchasing process.
A higher “Add to Cart Rate“ suggests that your ad and product offering are appealing, while a low rate may indicate that users are not finding what they expect or are facing friction in the shopping experience.
Monitoring this metric helps you identify areas for improvement in both your ad content and the overall user journey.
Initiate Checkout Rate
Initiate Checkout Rate measures the percentage of users who start the checkout process after adding items to their cart.
It is calculated by dividing the number of “Initiate Checkout” actions by the number of “Add to Cart” actions, then multiplying by 100. This metric provides valuable insight into how effectively your cart and checkout pages are encouraging users to move forward with their purchases.
A high “Initiate Checkout Rate” indicates that users are ready to make a purchase, while a low rate may suggest that there are barriers or friction points in the checkout process that are preventing users from completing the next step.
Monitoring this metric allows you to optimize the user experience and reduce potential abandonment.
Conversion Rate
Conversion Rate measures the percentage of users who complete a purchase after initiating the checkout process.
It is calculated by dividing the number of purchases by the number of “Initiate Checkout” actions, then multiplying by 100. This metric is critical for assessing the effectiveness of your checkout process in turning interested shoppers into paying customers.
A high conversion rate indicates that your checkout process is smooth and persuasive, while a low rate may point to issues like complicated steps, unexpected costs, or trust concerns that are causing potential customers to abandon their purchase.
Monitoring the conversion rate helps you identify and address friction points in the buying process to maximize sales and revenue.
How to Analyze Meta Ads Metrics?
Analyzing Meta Ads metrics effectively involves assessing key performance indicators (KPIs) to understand the performance of your campaigns and make data-driven decisions.
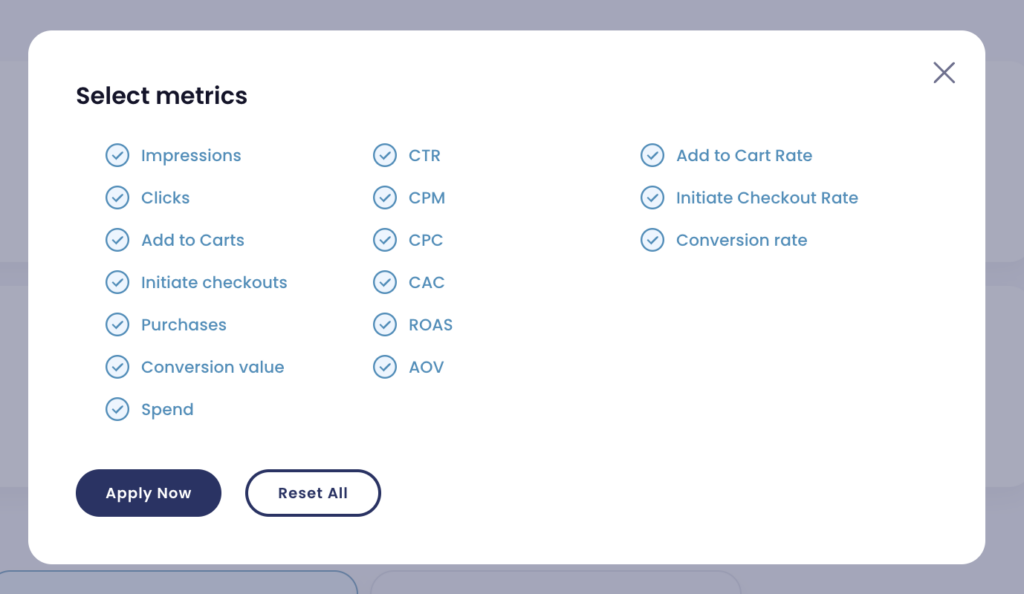
Start your analysis by selecting the metrics you want to analyze and the time for your analysis.
When using Lebesgue: AI CMO for your Meta Ads analytics, you’ll have everything in one place, making it easy to view all your key metrics. Additionally, Lebesgue provides unique insights such as add-to-cart rate and initiate checkout rate, which aren’t available in Meta’s dashboard.
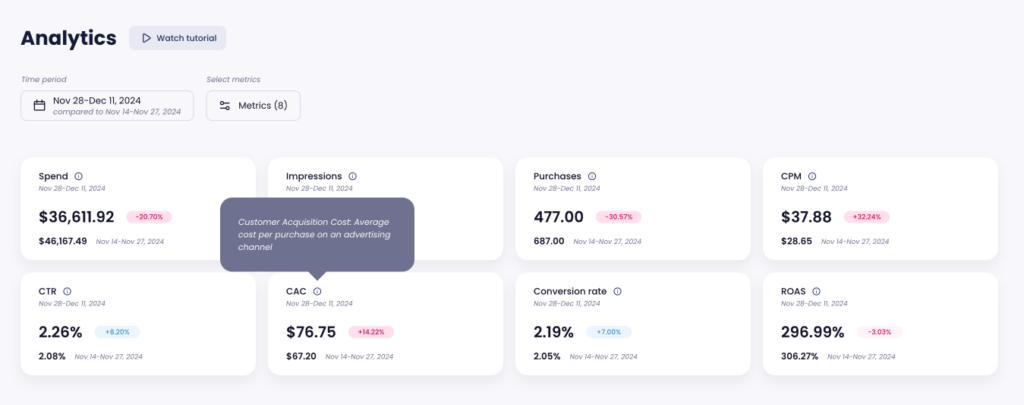
Once you’ve selected your metrics and time period, you’ll be able to see how they trend over time—whether they’re improving or declining compared to the previous period. With Lebesgue: AI CMO, you get a comprehensive view of all your metrics and their trends in one place.
To make tracking trends easier, you’ll be able to see how your metrics have changed. If a metric has improved, it will be highlighted in blue, along with the percentage of improvement. If a metric has declined, it will be shown in red, allowing you to quickly identify areas that need attention.
How to analyze Meta ad campaign structure?
This analysis covers your entire Meta Ads performance, including metrics for both prospecting and retargeting campaigns.
For a more detailed breakdown, you’ll need to break down each part of your campaign structure and analyze them separately.
In Lebesgue: AI CMO, you can view the metrics and performance for both your active and paused campaigns, broken down by each level of the campaign structure—campaign, ad set, and ad.
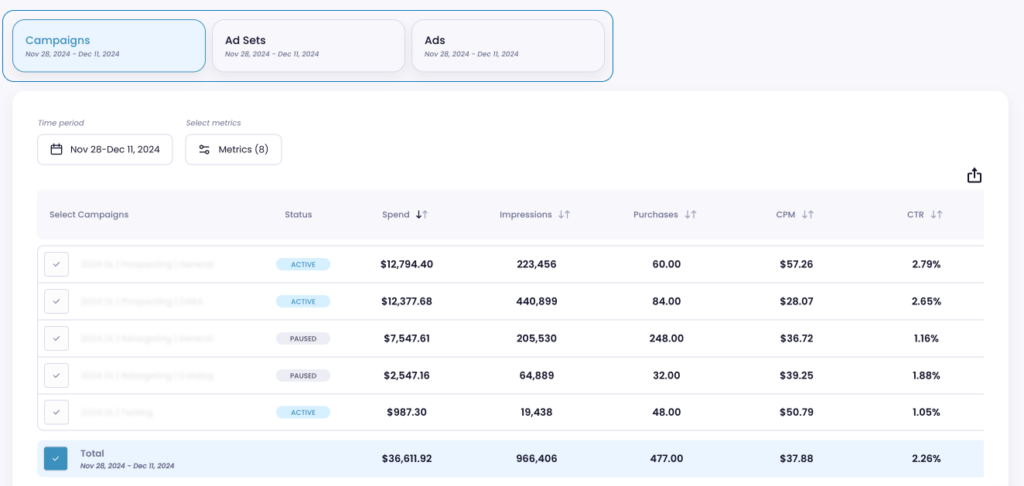
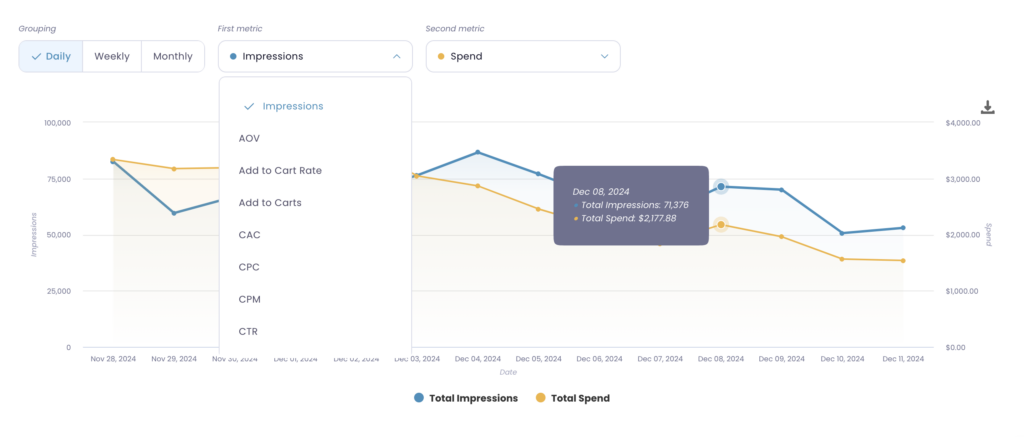
Below the campaign structure, you’ll find a graph that helps you visualize performance trends over time. You can customize the graph by grouping data into daily, weekly, or monthly views, depending on your analysis needs.
Additionally, the Lebesgue: AI CMO allows you to select two metrics to compare in the graph, enabling you to identify patterns and relationships between different performance indicators, such as Spend, ROAS, or Clicks.
This structured and interactive view ensures you have the insights needed to optimize your strategies at every level of your advertising efforts.
Analyze performance by landing page
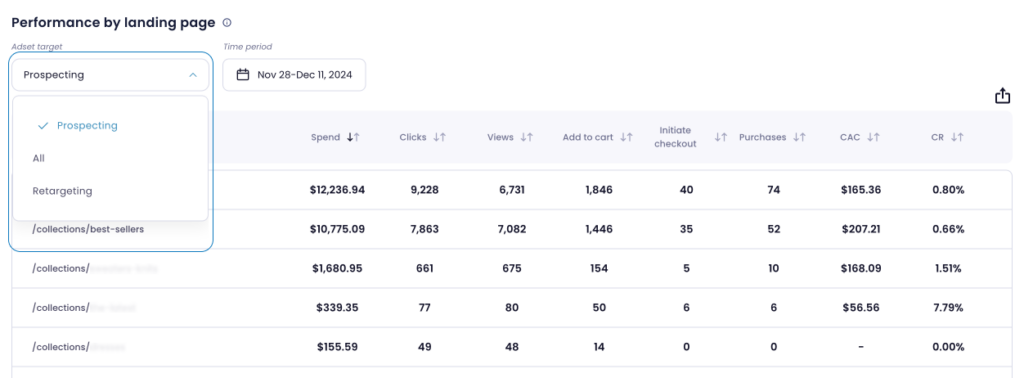
The Performance by Landing Page section provides a powerful way to analyze how your landing pages are performing across different ad set targets.
In Lebesgue: AI CMO, you can filter the data to focus on specific audience types—All, Prospecting, or Retargeting—and choose a custom time period for your analysis. This section displays key performance metrics for each landing page, giving you insights into how effectively your audience is engaging with your content based on their stage in the funnel.
By understanding which landing pages perform best for different targets, you can optimize your strategy to ensure your audience is directed to the most suitable pages, ultimately helping you maximize your ROAS and overall campaign success.
Benefits of Using Analytics Apps
Using analytics apps to analyze your Meta ads performance offers a range of powerful benefits that can significantly improve your advertising results.
One major advantage is the ability to optimize campaigns more effectively. Analytics tools provide insights into which ads are performing well and which are not, allowing you to allocate your budget to high-performing campaigns and stop wasting money on underperforming ones.
This data-driven approach ensures your resources are used more efficiently.
Analytics apps also save time by automating the tracking and organization of campaign data. Instead of manually sifting through reports, you can access all the metrics you need—such as ROAS, CTR, and CPA—in one place.
Additionally, they often include advanced reporting features, making it easier to identify trends and track audience performance. With a clear understanding of which audiences convert best, you can refine your targeting strategy to improve your ROI.
Summing Up
Meta is a cornerstone of digital marketing, offering businesses an unparalleled platform to reach and engage their target audiences.
However, running Meta ads is just the beginning—true success lies in analyzing and optimizing your campaigns.
Meta Analytics offers a wealth of data and metrics to help you understand your audience, evaluate ad performance, and make data-driven decisions to achieve your goals.
With detailed analytics, you have the ability to monitor trends over time and plan future campaigns more effectively.

