A Shopify report is a set of analytics and insights provided within Shopify to help store owners track and analyze their business performance. These reports are available in the Analytics section of the Shopify admin and vary based on your Shopify plan.
While Shopify offers robust native reporting tools, store owners often need more advanced, customized, or integrated insights to optimize their business operations. Reporting apps fill this gap by offering features that go beyond Shopify’s standard analytics.
Why Use Shopify Reporting Apps?
Shopify reporting apps provide enhanced analytics capabilities that go beyond Shopify’s built-in tools. They cater to businesses looking for deeper insights, better efficiency, and more actionable data to drive growth. Here’s why you might need them:
- Advanced customization
- Comprehensive data integration
- In-depth insights
- Automation
- Real-time monitoring
- Enhanced data visualization
- Profitability tracking, and
- Scalability and growth
Shopify’s default reporting tools, especially on lower-tier plans, can be restrictive. Reporting apps allow you to:
- Create highly customized reports.
- Combine multiple data points (e.g., sales + marketing metrics).
- Filter by unique variables specific to your business.
Shopify reporting apps are invaluable for store owners looking to save time, track detailed performance metrics, and make data-driven decisions. By integrating these apps, you can better understand your business, optimize operations, and drive sustainable growth.
Lebesgue: AI CMO Shopify Reporting App
Lebesgue: AI CMO is an excellent choice for a Shopify reporting app because it combines deep analytics, competitive intelligence, and actionable recommendations, all tailored to help e-commerce stores grow.
Its ability to provide both data insights and specific strategies for optimization makes it a powerful tool for scaling your store and outperforming competitors.
Business report
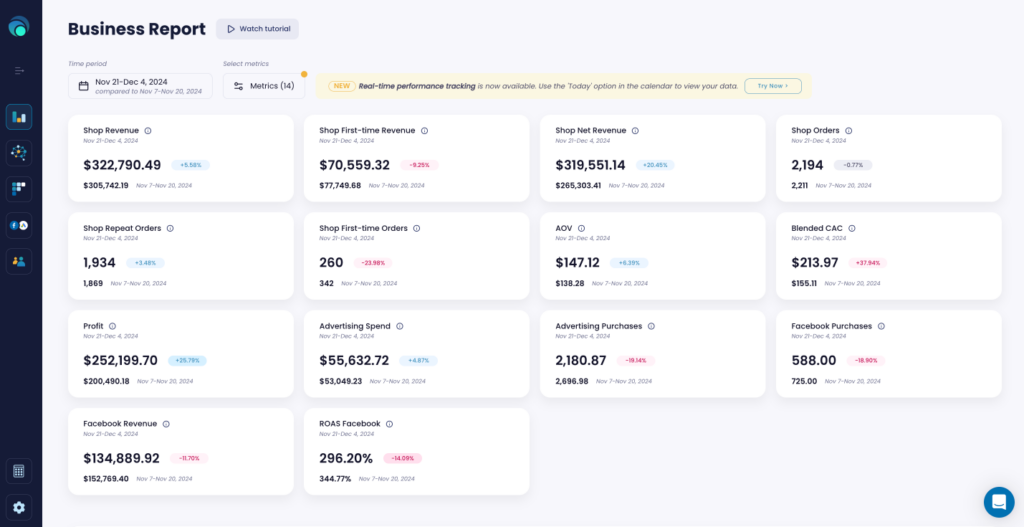
The Business Report lets you consolidate all your essential business metrics in one place. You can easily track your advertising spend, product costs, and revenue, giving you a clear picture of your profit and ROAS.
The report allows you to group the data by day, week, or month, so you can spot trends, patterns, and outliers.
The goal of this feature is to bring all your essential Shopify metrics together in one place, alongside your advertising data from platforms like Meta ads, Google ads, TikTok ads, Amazon ads and Klaviyo. We also integrate your Google Analytics data, giving you a comprehensive view of your business performance over any period you choose to analyze.
This way, you can easily see the full picture of what’s happening with your business.
You can customize your report and choose the metrics and time frame that you want to analyze.
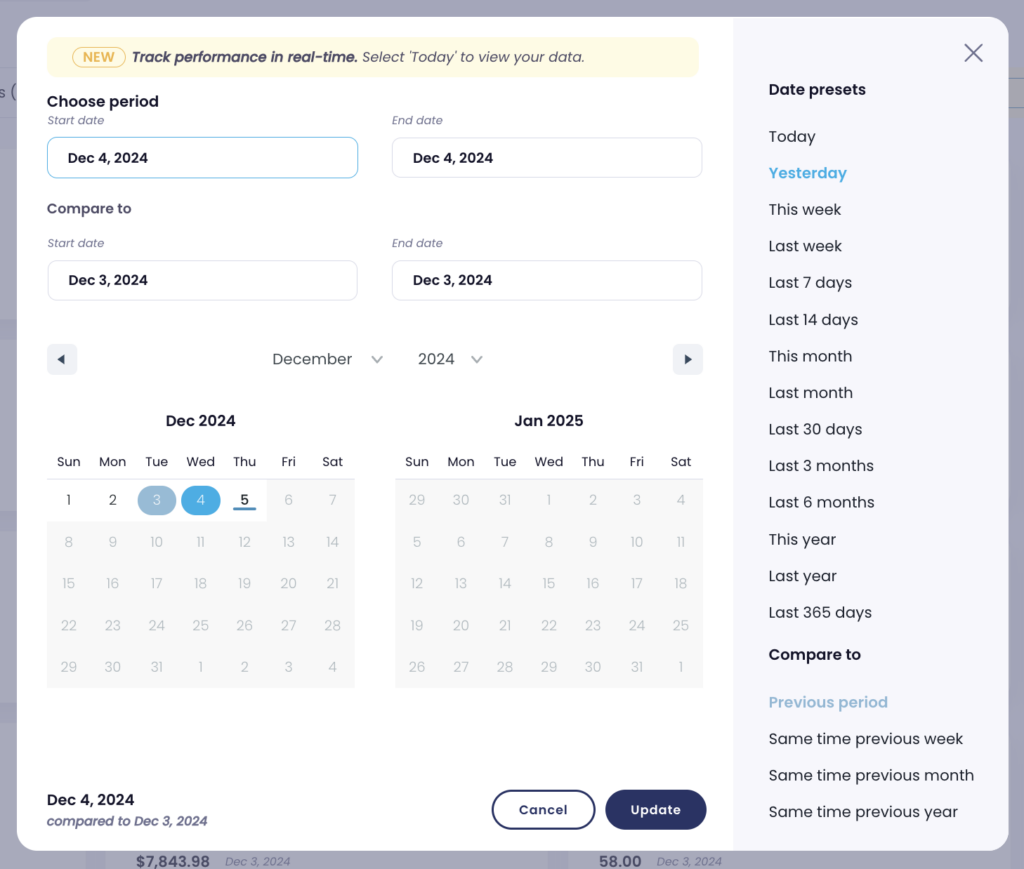
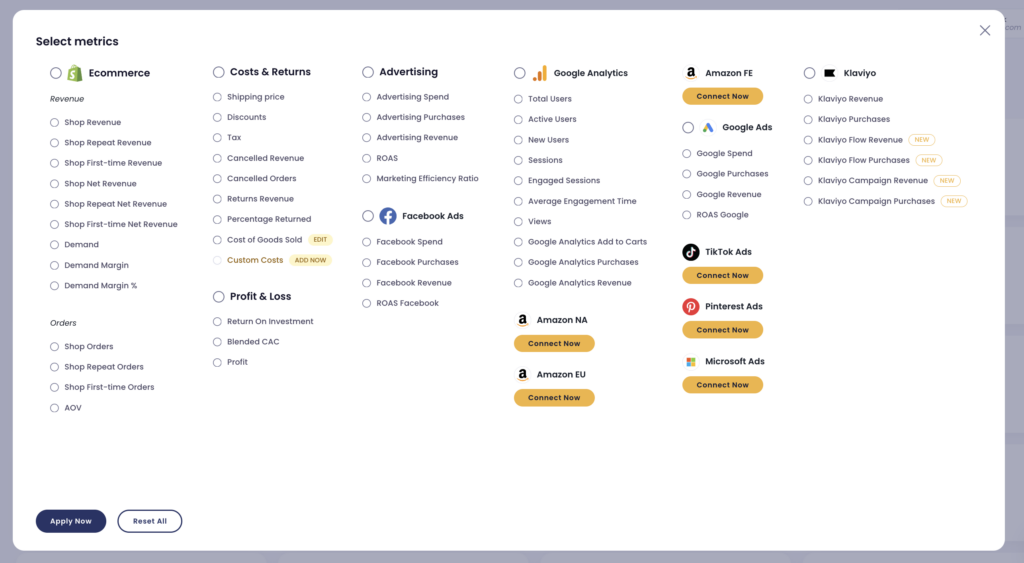
Once you select the metrics and time period you’d like to analyze, the custom report will be automatically generated. You’ll be able to see how your metrics have changed, with blue indicating improvements compared to the previous period, and red highlighting any declines.
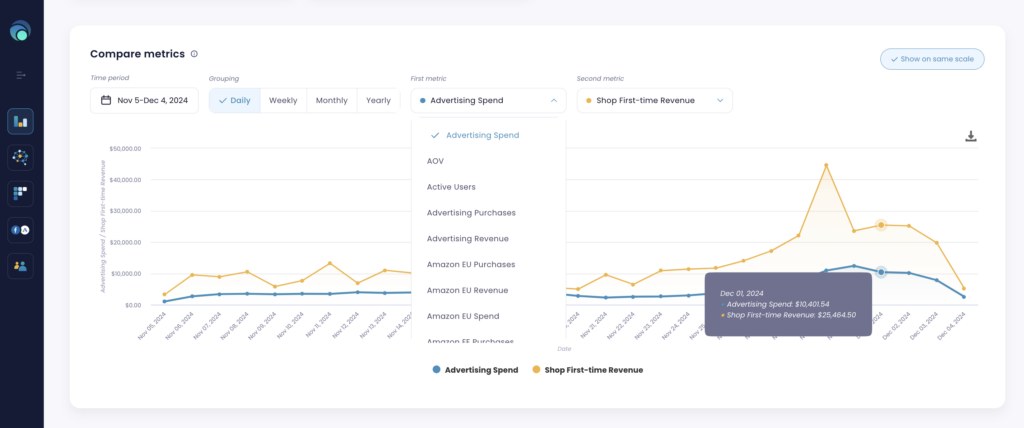
Compare metrics
With the Compare metrics feature, you can analyze how your metrics perform over time.
Simply choose the metric you want to track, select a date range, and group the data by day, week, or month. This allows you to visualize the trends and patterns in your data, helping you understand how different metrics, like Facebook purchases and first-time orders, correlate with each other.
It also helps you spot seasonal trends in your business.
Pro tip: Focus on first-time orders, as they give you valuable insight into your customer acquisition. If you notice more Facebook or Google purchases than first-time orders, it could indicate that your advertising channels are targeting the same audience too much, leading to overspending on the same group of customers.
Business overview table
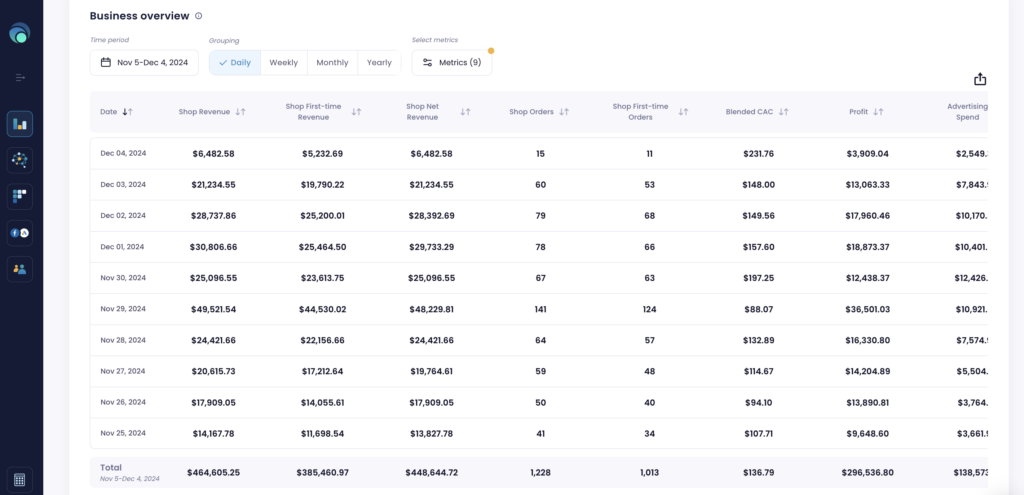
The Business Overview Table gives you a quick snapshot of all your key metrics in one place, such as Revenue, First-time Revenue, Ad Spend, CoGS (Cost of Goods Sold), and more. By viewing these metrics side by side, you can easily compare and assess how your business is performing on a daily, weekly, or monthly basis.
This layout makes it easier to spot patterns in your data and identify trends or changes in performance. Having all these key numbers in one table helps you quickly gauge the overall health of your shop and make informed decisions.
If you need to do more custom analysis, you can easily download the table for further exploration and manipulation of the data.
Benefits of Using Lebesgue's Business Report
Lebesgue’s Business Report offers a comprehensive, data-driven overview that brings all your key metrics into one place, streamlining your analysis and decision-making.
With easy access to crucial Shopify metrics like Revenue, First-time Revenue, Ad Spend, and CoGS, alongside your advertising data from Meta, Google, TikTok, and Klaviyo, you can gain a complete view of your business performance.
The report’s flexibility allows you to group data by day, week, or month, helping you spot trends and seasonal patterns that influence your business. Visual indicators highlight positive and negative shifts, making it easy to track performance changes over time.
Customizable and automated reports save time, while the ability to download your data for further analysis gives you greater control.
What’s even better is that the Business Report is available on the free plan of the Lebesgue app, meaning you can access these powerful insights without any additional cost.
Summing Up
Lebesgue’s Business Report provides an easy, centralized way to track all your key Shopify and advertising metrics in one place, even on the free plan. With customizable, automated reports and the ability to download your data for further analysis, it’s the perfect tool to help you make informed decisions, optimize ad spend, and drive growth.
Get started today and see the power of data-driven insights. Install the app now and unlock the full potential of your business performance!
Frequently Asked Questions about Shopify Business Reporting
Lebesgue’s Business Report centralizes your key metrics in one place, so you can easily track:
- Revenue, First-time Revenue, Ad Spend, CoGS (Cost of Goods Sold), and more.
- View your metrics over customizable time periods (daily, weekly, or monthly).
- Quickly analyze how your business is performing by comparing multiple metrics side by side.
Yes! The Business Report integrates both Shopify data and ad performance, allowing you to track:
- Performance metrics from Meta Ads, Google Ads, and TikTok Ads.
- Key e-commerce metrics like revenue, product costs, and profit margins. This unified approach helps you measure your ad spend against your sales and better understand your return on investment (ROAS).
With Lebesgue, you can easily visualize trends over time:
- Group your metrics by day, week, or month.
- Use charts and graphs to spot patterns in your revenue, ad spend, and product performance.
- Quickly identify seasonal trends, changes in customer behavior, or periods of over- or under-spending on ads.
Lebesgue’s Business Report is designed for data-driven decision-making:
- Access real-time insights to adjust your ad budgets, optimize your inventory, and refine your marketing strategies.
- Make informed decisions on what’s working and what’s not, all based on data from your store, ads, and competitors.
Lebesgue is designed with simplicity in mind:
- The Business Report provides easy-to-read visual dashboards.
- Quickly access key insights and download data for further analysis when needed.
- The clean interface makes it easy to spot patterns, track key metrics, and adjust your business strategies on the fly.
Yes! Lebesgue’s Business Report is highly customizable:
- Track the metrics that matter most to your business, such as sales trends, ad performance, and inventory health.
- Adjust time periods and filters to focus on your specific goals, whether it’s scaling campaigns, optimizing ad spend, or increasing first-time sales.
Lebesgue is built specifically for Shopify and WooCommerce store owners:
- It tracks all essential e-commerce metrics such as sales, customer acquisition, conversion rates, and product performance.
- You can rely on the Business Report to get a comprehensive view of your store’s health and make smarter business decisions.


