Analyzing Google Ads performance is crucial to ensure your advertising budget is being used effectively. It helps you identify what’s working and what’s not, optimize campaigns for better ROI, reduce wasted spend, and improve targeting.
By regularly evaluating performance metrics, you can make data-driven decisions to achieve your business goals.
But how do you know which metrics to focus on, and what to do with the data you have? Don’t worry, today we’ll cover how to make your Google Ads analysis more effective.
What should you do before analyzing Google Ads performance?
Before you begin analyzing your Google Ads performance, it’s crucial to take a few steps to ensure you have the right data and context for meaningful analysis.
First, establish clear goals for your campaigns. For Shopify stores, this is most likely to drive purchases.
Next, verify that your conversion tracking is properly set up. Accurate data is essential for making informed decisions that can improve your campaigns and help grow your store.
Finally, ensure you fully understand the metrics and their meanings. Misinterpreting these metrics can lead to incorrect conclusions and misguided decisions, so it’s important to know what each number represents to make the analysis effective.
Let’s explain the most important Google Ada metrics for analyzing performance.
Key Google Ads metrics for performance analysis
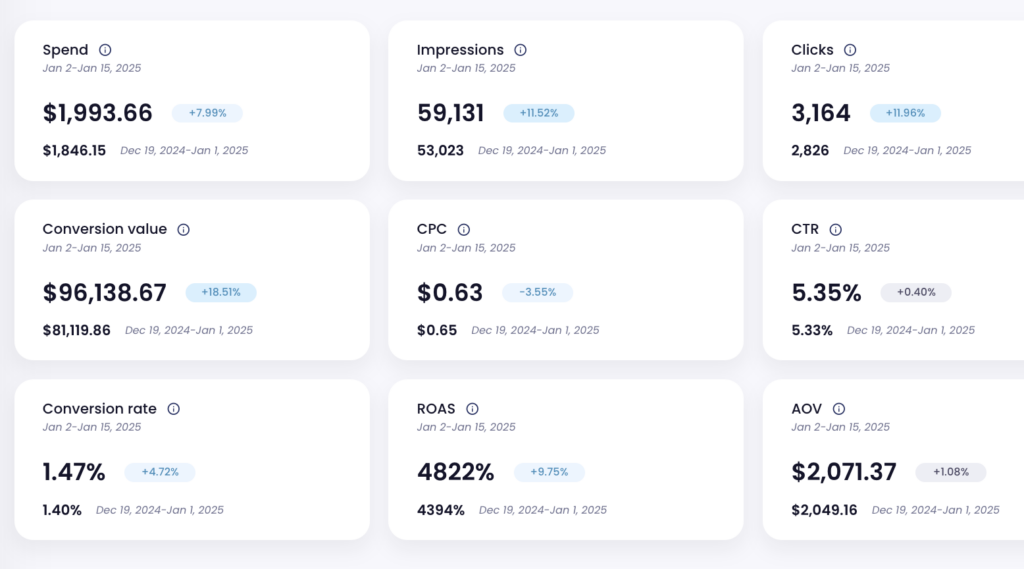
Here’s a short explanation of each metric in Google Ads:
Impressions: The number of times your ad is shown to users.
Clicks: The number of times users click on your ad.
Cost: The total amount you’ve spent on your Google Ads campaign.
CPC (Cost-Per-Click): The average amount you pay for each click on your ad.
CTR (Click-Through Rate): The percentage of impressions that resulted in a click. It’s calculated as (Clicks / Impressions) * 100.
Conversions: The number of desired actions (e.g., purchases, sign-ups) taken by users after clicking your ad.
CR (Conversion Rate): The percentage of clicks that resulted in conversions. It’s calculated as (Conversions / Clicks) * 100.
ROAS (Return on Ad Spend): The revenue generated for every dollar spent on ads. It’s calculated as (Revenue from Ads / Cost of Ads).
Cost/Conversion: The average cost for each conversion. It’s calculated as (Cost / Conversions).
CAC (Customer Acquisition Cost): The average cost to acquire a paying customer, which includes all marketing and sales expenses. For Google Ads, Cost/Conversion can often be used as an approximation of CAC if your conversions represent customers or sales.
How to analyze Google Ads performance successfully?
You can analyze Google Ads performance in a few different ways. We recommend using both the Google Ads dashboard and Lebesgue: AI CMO for a comprehensive view.
In the Google Ads dashboard, you can dive deep into campaign structure, optimization, and keyword analysis, while with Lebesgue: AI CMO, you’ll gain insights into trends and track how your performance evolves over time.
First, let’s see how to use the Google Ads dashboard for your analysis.
Step 1: Select your campaign
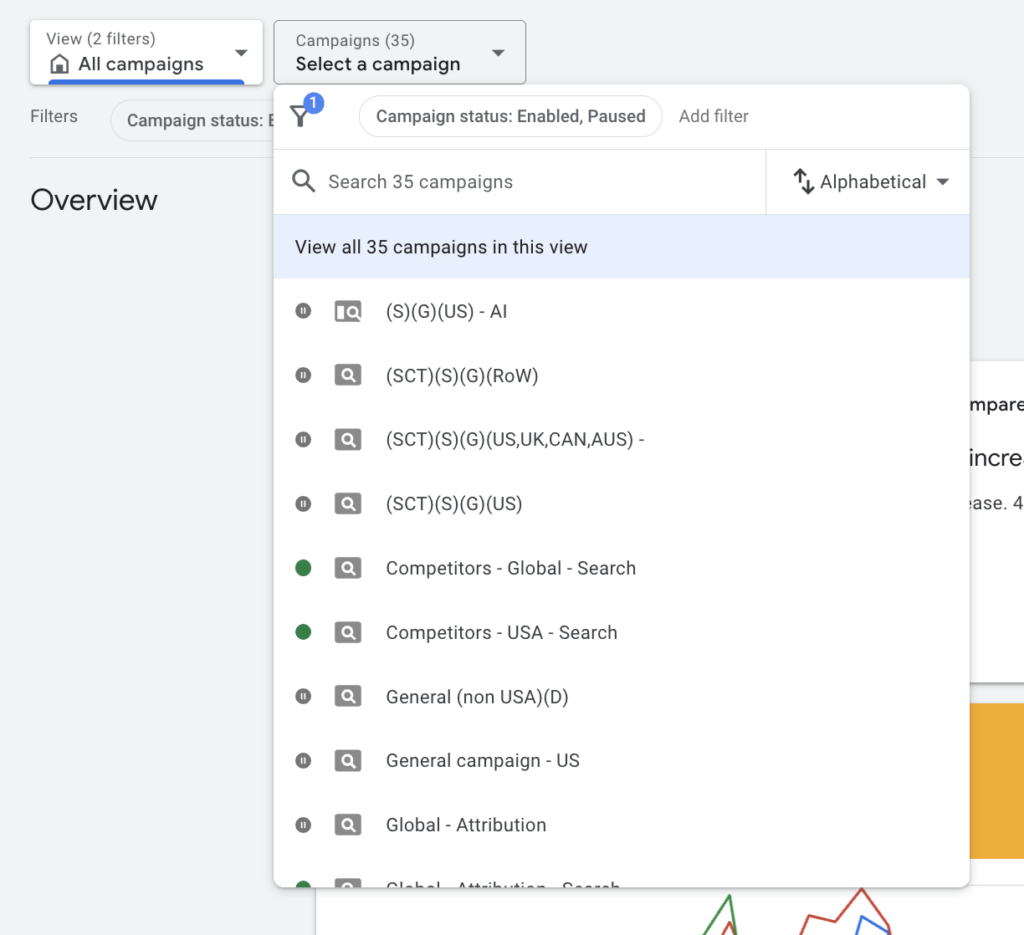
After logging in to your Google Ads account, select the campaign you like to analyze.
To do so you’ll need:
- Click on Campaigns in the left-hand navigation pane.
- Choose the specific campaign you want to analyze.
Step 2: Choose a date range
At the top right, select the date range that you want to analyze (e.g., last 7 days, last 30 days, or a custom range).
Use the Date Range selector to compare performance over different time periods if needed.
Step 3: Review key metrics
In the dashboard, you’ll see an overview of performance with key metrics displayed, including:
- Impressions
- Clicks
- Cost
- CPC
- CTR
- Conversions
- Conversion Rate (CR)
- ROAS
- Cost/Conversion
Make sure to check these metrics that align with your campaign goals (e.g., if your goal is a purchase, focus on Conversion, Cost/Conversion, and ROAS).
Step 4: Analyze the campaign performance
- Impressions & Clicks: Check the Impressions and Clicks to evaluate your ad reach and how often users are interacting with your ads.
- CTR (Click-Through Rate) tells you how effective your ad is at encouraging clicks. A low CTR could indicate your ad copy or targeting needs optimization.
- Cost & CPC: Review the Cost and CPC to assess your spend and efficiency in acquiring clicks. Compare the CPC with your expected cost to ensure your bidding strategy is in line with your goals.
- Conversions & CR: Check the Conversions and Conversion Rate to evaluate how well your ads are driving the desired actions (purchases, sign-ups). A low CR could indicate that your landing page, product offering, or conversion funnel needs improvement.
- ROAS: Return on Ad Spend tells you how much revenue you’re generating for every dollar spent. If your ROAS is low, you may need to adjust targeting, ads, or bids to improve profitability.
- Cost/Conversion & CAC: Assess how much you’re paying per conversion (or customer) to gauge your Customer Acquisition Cost (CAC). If this cost is too high, consider optimizing your campaigns to lower it.
Step 5: Use Google Ads reports
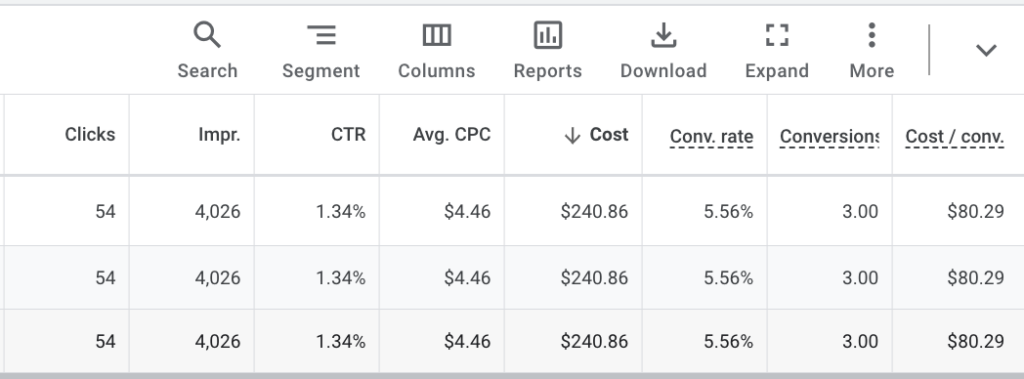
Click on the Reports tab to create custom reports that break down performance further by ad group, keyword, or device.
Use Filters to narrow down performance to specific segments, such as location, device, or audience type.
Step 6: Identify areas for improvement
When analyzing your campaign performance, it’s crucial to identify areas that need improvement. The key areas with the most potential for optimization are:
- Keywords
- Ads
- Bidding
Keywords: Review your keywords to see which ones are generating the most clicks and conversions. Add negative keywords to exclude irrelevant traffic and improve targeting.
Ads: Assess your ad copy to determine which versions are performing best. A/B tests different variations to identify the most effective messaging.
Bidding: Evaluate your bidding strategy. If you’re using manual bidding, consider switching to automated strategies like Target ROAS to better align with your goals.
Step 7: Track attribution
On the journey to conversion, a customer may perform multiple searches and interact with several ads from the same advertiser. Attribution models allow you to determine how much credit each click receives for a conversion.
You can assign credit to the customer’s first click, last click, or a combination of multiple interactions.
Therefore, it’s important to review the Attribution reports to understand how different touchpoints contribute to conversions, helping you allocate your budget more effectively across campaigns.
Step 8: Optimize campaigns based on insights
After analyzing your data, it’s crucial to take targeted actions to improve underperforming areas:
Campaign Settings: Refine your audience targeting by focusing on the most profitable segments, such as specific demographics, locations, or devices. Also, adjust your ad schedule to ensure ads are shown when they’re most likely to drive conversions.
Bidding Strategies: Review your bidding strategy. If you’re relying on manual bidding, consider switching to automated options like Target ROAS to let Google optimize your bids for conversions, improving efficiency and ROI.
Keywords: Regularly audit your keywords. Add negative keywords to eliminate irrelevant traffic, and boost bids on high-converting keywords. Expanding your keyword list by adding relevant terms can also help you reach untapped audiences.
Ad Creatives: Analyze which ads are driving the best results and adjust your messaging accordingly. Test new variations to see what resonates most with your audience. Consistently optimizing your ad copy can significantly increase engagement and conversions.
By applying these adjustments based on your insights, you’ll enhance campaign performance, optimize ad spend, and ultimately drive more conversions.
Analyze Google Ads performance with Lebesgue AI CMO
Let’s start by exploring the analytics feature in Lebesgue for Google Ads. This feature is designed to provide comprehensive insights into your Google Ads performance, covering all key activities within your account.
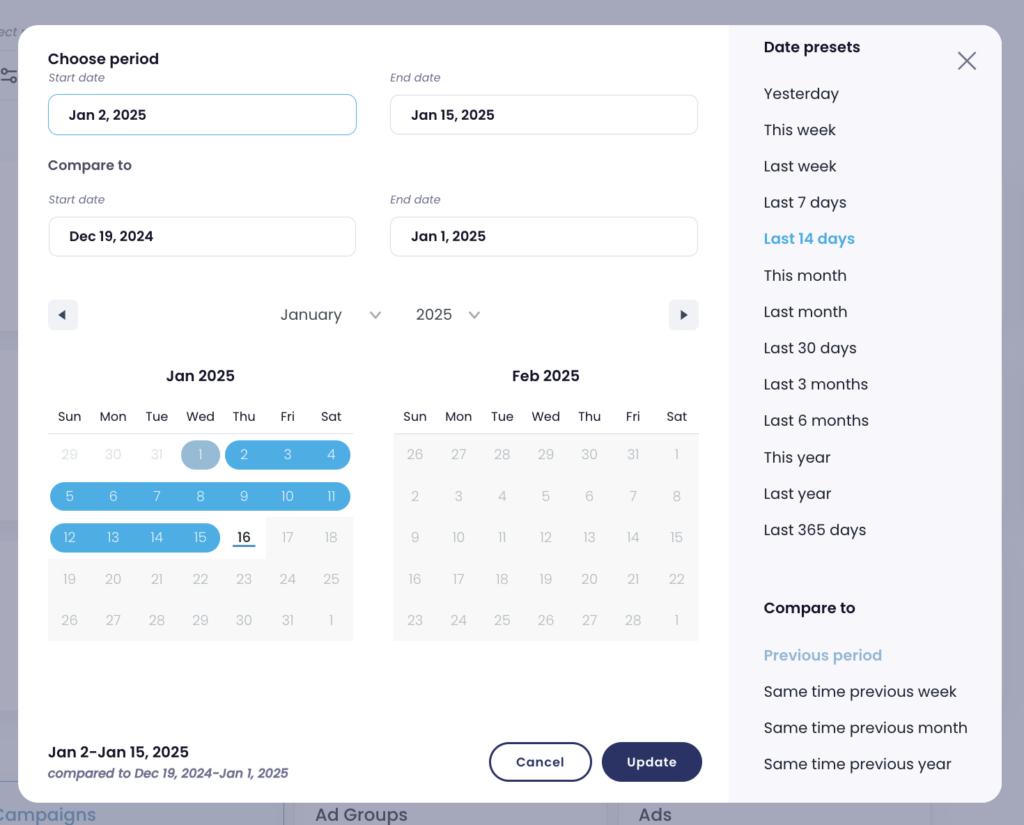
To begin, you can select different time periods from the top-right corner. By default, your selected period will be compared to the same period from the previous time frame.
When you choose the time frame you’d like to analyze, the relevant metrics for that period will be displayed, and you’ll be able to see if a metric has improved or declined compared to the previous period.
Additionally, you have the option to select specific metrics to analyze and customize the report to focus on the data that matters most to you.

After analyzing the trends of changes in your most important metrics, you can move on to the next part of the feature: Campaign Analytics.
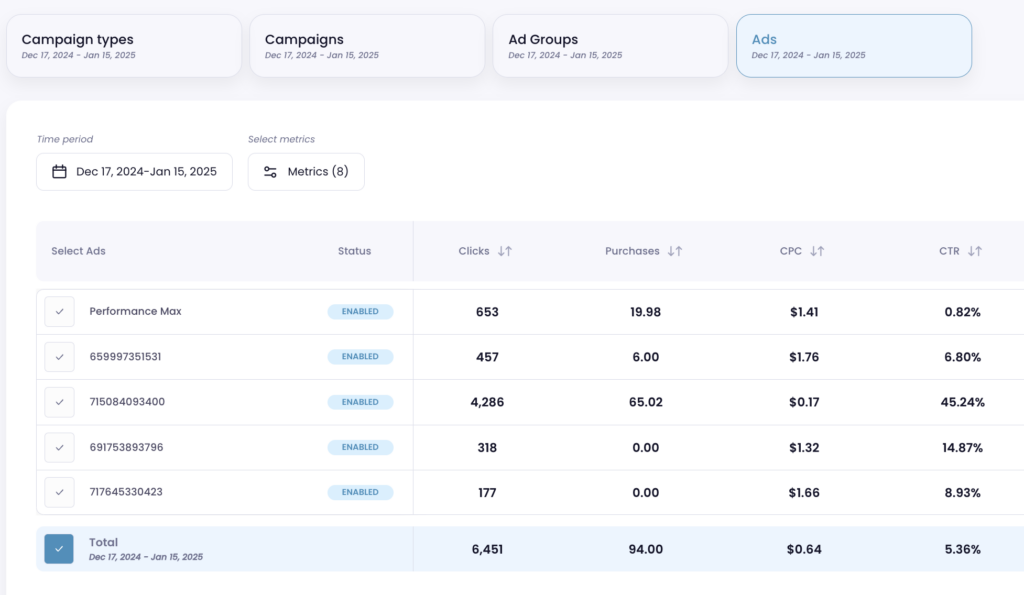
This section is similar to what you’ll find in Google Ads Manager, allowing you to filter by campaign types, individual campaigns, ad groups, and even specific ads.
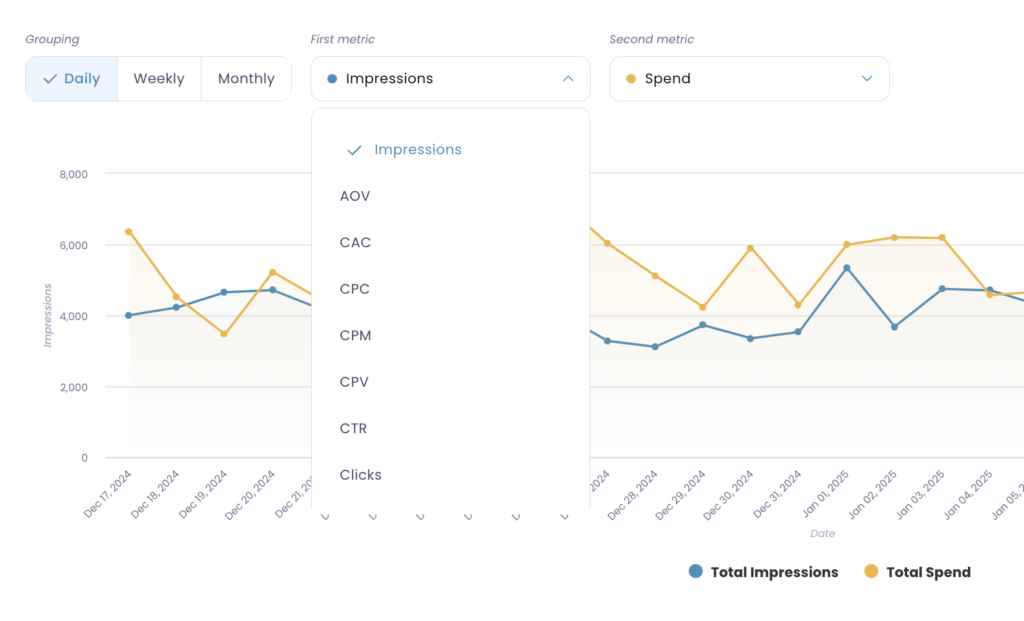
Below the table, you’ll find a graph where you can compare two different metrics. You can choose to compare metrics for different campaign types or view the total data.
For example, you can compare conversions and spend at daily, weekly, or monthly levels. This allows you to see how much you’re spending versus the amount of purchases you’re generating, helping you assess the efficiency of your campaigns.
How to analyze Performance Max?
For analyzing Performance Max campaigns, Lebesgue provides you with an ad spend overview: You can understand how your ad spend is automatically distributed across different Google networks within your campaigns.
This insight helps you see where your budget is allocated, enabling you to assess the effectiveness of your campaign strategy and optimize future campaigns.
Please note that these numbers are approximations based on available Google Ads data, as Google Ads does not provide precise breakdowns for Performance Max campaigns.
These figures offer valuable insights into metrics across various Google networks, giving you a clearer picture of your campaign’s overall performance.

Summing Up
Analyzing your Google Ads performance is crucial for understanding how effectively your campaigns are driving results. By evaluating key metrics like conversions, cost, and ROAS, you can identify areas for improvement, optimize your ad strategy, and make data-driven decisions.
Regular analysis helps you allocate your budget more efficiently, improve targeting, and ultimately increase the return on your ad spend, driving better business outcomes.


