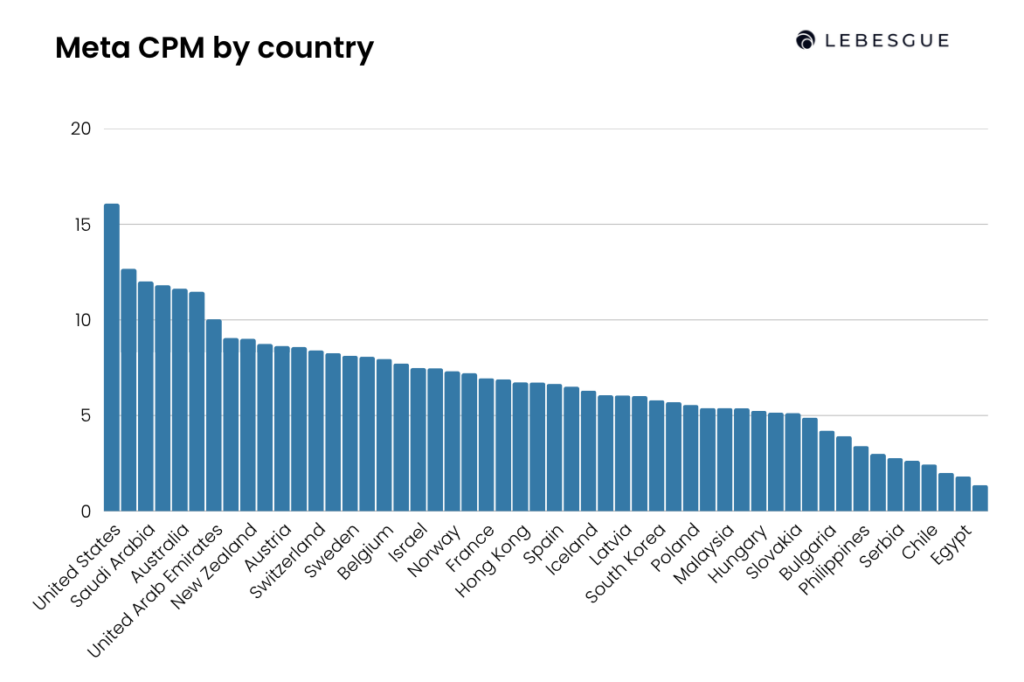
Facebook advertising costs vary significantly depending on the country you’re targeting. According to our latest ecommerce benchmark data, Facebook CPM ranges from $1.36 in India to $16.08 in the United States, highlighting just how much geography can influence the cost of reaching potential customers through Meta Ads.
However, a higher CPM doesn’t necessarily mean your campaigns are performing poorly. Countries with the highest advertising costs often have stronger purchasing power, higher customer lifetime value, and more competition among advertisers, while lower-cost markets may offer cheaper reach but different conversion rates and buying behaviour.
In this blog post, we’ll break down Facebook Ads CPM by country using 2026 ecommerce benchmark data, explain why CPM varies across markets, identify the most and least expensive countries to advertise in, and show you how to use these benchmarks to evaluate and optimise your own Meta Ads campaigns.
Facebook Ads CPM by Country
Facebook Ads CPM varies significantly depending on the country you’re targeting. In our 2026 ecommerce benchmark data, CPM ranges from $1.36 in India to $16.08 in the United States, with the highest advertising costs typically found in mature ecommerce markets where advertiser competition is strongest.
While countries with lower CPM allow advertisers to reach more people for the same budget, lower costs don’t necessarily translate into better campaign performance. Higher-cost markets often have greater purchasing power, higher average order values, and stronger customer lifetime value.
| Metric | Country / Region | Value |
|---|---|---|
| Highest Facebook Ads CPM | United States | $16.08 |
| Lowest Facebook Ads CPM | India | $1.36 |
| Highest CPM in Europe | United Kingdom | $11.81 |
| Lowest CPM in Europe | Bulgaria | $4.21 |
| Highest CPM Regions | North America, Middle East, Western Europe | High |
| Lowest CPM Regions | South Asia, Latin America | Low |
Facebook Ads CPM is influenced by advertiser competition, purchasing power, audience demand, and market maturity. The most useful benchmark isn’t the global average—it’s how your CPM compares with other advertisers targeting the same country.
NOTE: In Lebesgue AI CMO you can compare your CPM with industry average and see how your campaigns compare to the competition.
2026 Facebook Ads CPM Benchmarks by Country
Facebook Ads CPM varies considerably across countries, reflecting differences in advertiser competition, purchasing power, and market maturity. In our latest ecommerce benchmark, CPM ranges from $1.36 in India to $16.08 in the United States, with most Western European markets falling between $7 and $12.
Use the table below to compare Facebook Ads CPM benchmarks across 50 countries. If your campaigns consistently perform above or below these averages, it may indicate opportunities to optimise your targeting, creatives, or bidding strategy.
Keep in mind that CPM benchmarks provide valuable context, but they should never be evaluated in isolation. A higher CPM doesn’t automatically mean poor performance if your campaigns generate strong click-through rates, conversions, and return on ad spend.
| Country | Facebook Ads CPM | Relative Cost |
|---|---|---|
| United States | $16.08 | Very High |
| Qatar | $12.67 | Very High |
| Saudi Arabia | $12.01 | Very High |
| United Kingdom | $11.81 | Very High |
| Australia | $11.63 | Very High |
| Canada | $11.47 | Very High |
| United Arab Emirates | $10.00 | High |
| Germany | $9.05 | High |
| New Zealand | $9.01 | High |
| Denmark | $8.74 | High |
| Austria | $8.63 | High |
| Netherlands | $8.58 | High |
| Switzerland | $8.40 | High |
| Ireland | $8.26 | High |
| Sweden | $8.12 | High |
| Kuwait | $8.07 | High |
| Belgium | $7.96 | Medium |
| Finland | $7.72 | Medium |
| Israel | $7.48 | Medium |
| Luxembourg | $7.47 | Medium |
| Norway | $7.31 | Medium |
| Singapore | $7.21 | Medium |
| France | $6.95 | Medium |
| Estonia | $6.89 | Medium |
| Hong Kong | $6.73 | Medium |
| Japan | $6.73 | Medium |
| Spain | $6.65 | Medium |
| Lithuania | $6.51 | Medium |
| Iceland | $6.30 | Medium |
| Italy | $6.06 | Medium |
| Latvia | $6.05 | Medium |
| Portugal | $6.02 | Medium |
| South Korea | $5.80 | Medium |
| Czech Republic | $5.70 | Medium |
| Poland | $5.55 | Medium |
| Croatia | $5.39 | Medium |
| Malaysia | $5.39 | Medium |
| Romania | $5.38 | Medium |
| Hungary | $5.24 | Medium |
| Slovenia | $5.15 | Medium |
| Slovakia | $5.12 | Medium |
| Greece | $4.89 | Low |
| Bulgaria | $4.21 | Low |
| Mexico | $3.92 | Low |
| Philippines | $3.40 | Low |
| South Africa | $2.99 | Very Low |
| Serbia | $2.77 | Very Low |
| Brazil | $2.63 | Very Low |
| Chile | $2.44 | Very Low |
| Colombia | $2.00 | Very Low |
| Egypt | $1.81 | Very Low |
| India | $1.36 | Very Low |
Highest Facebook Ads CPM Countries
The most expensive Facebook advertising markets are concentrated in countries with strong economies, mature ecommerce sectors, and intense advertiser competition. Businesses targeting these markets often pay more to reach potential customers, but they also benefit from higher purchasing power and greater revenue potential.
The five countries with the highest Facebook Ads CPM in our benchmark are:
| Country | Facebook Ads CPM |
|---|---|
| United States | $16.08 |
| Qatar | $12.67 |
| Saudi Arabia | $12.01 |
| United Kingdom | $11.81 |
| Australia | $11.63 |
The United States remains the most competitive Facebook advertising market, with a CPM nearly twelve times higher than India. Similarly, countries such as Qatar, Saudi Arabia, and the United Kingdom command premium advertising costs due to strong advertiser demand and competitive digital markets.
Lowest Facebook Ads CPM Countries
At the other end of the benchmark are countries where advertisers can reach large audiences at a significantly lower cost.
The five countries with the lowest Facebook Ads CPM are:
| Country | Facebook Ads CPM |
|---|---|
| India | $1.36 |
| Egypt | $1.81 |
| Colombia | $2.00 |
| Chile | $2.44 |
| Brazil | $2.63 |
Lower CPM makes these markets attractive for expanding reach and testing new audiences. However, advertisers should remember that lower advertising costs don’t always result in lower customer acquisition costs. Conversion rates, purchasing power, shipping costs, and average order value all influence campaign profitability.
Facebook Ads CPM by Region
Looking at individual countries is useful, but broader regional trends provide even more context. Markets with similar economic conditions, purchasing power, and advertiser competition often have comparable Facebook Ads CPMs.
North America
North America remains the most expensive region for Facebook advertising. The United States leads our benchmark with the highest CPM at $16.08, while Canada also ranks among the world’s most competitive markets at $11.47. High advertiser demand, mature ecommerce markets, and strong purchasing power all contribute to these higher advertising costs.
Western Europe
Western Europe consistently falls into the high-cost category, with countries such as the United Kingdom, Germany, the Netherlands, Switzerland, and Denmark all reporting CPMs between approximately $8 and $12. These markets are highly competitive but also tend to attract high-intent shoppers.
Middle East
Several Gulf countries rank among the world’s most expensive advertising markets. Qatar ($12.67), Saudi Arabia ($12.01), Kuwait ($8.07), and the United Arab Emirates ($10.00) all demonstrate that strong purchasing power and advertiser demand can drive CPM well above the global average.
Asia-Pacific
Asia-Pacific shows the greatest variation. Developed markets such as Japan ($6.73), Singapore ($7.21), and South Korea ($5.80) have moderate CPMs, while emerging markets including India ($1.36) and the Philippines ($3.40) remain among the most affordable places to advertise on Facebook.
Latin America
Latin America offers some of the lowest Facebook Ads CPMs in our benchmark. Brazil, Chile, Colombia, and Mexico all have relatively low advertising costs, making the region attractive for brands looking to expand reach efficiently. However, advertisers should evaluate profitability using additional metrics such as conversion rate, average order value, and ROAS rather than CPM alone.
What Is a Good Facebook Ads CPM?
One of the most common questions advertisers ask is, “What is a good Facebook Ads CPM?” The answer depends on several factors, including the country you’re targeting, your industry, campaign objective, audience, and the time of year.
There isn’t a single CPM benchmark that’s considered “good” for every advertiser. A campaign with a $12 CPM in the United States may be performing exceptionally well, while the same CPM in India would likely indicate that your campaigns are significantly more expensive than average.
Rather than comparing your CPM to a universal benchmark, compare it with advertisers targeting the same country and market. This provides a much more accurate picture of whether your advertising costs are competitive.
Based on our benchmark data, Facebook Ads CPMs generally fall into five market tiers. Use these ranges as a reference when evaluating whether your advertising costs are competitive within the countries you’re targeting.
| Market Tier | Typical Facebook Ads CPM | Typical Characteristics |
|---|---|---|
| Very High | $11+ | Mature ecommerce markets with intense advertiser competition and high purchasing power. |
| High | $8–11 | Competitive digital advertising markets with strong consumer demand and established online shopping. |
| Medium | $5–8 | Balanced competition across developed and growing ecommerce markets. |
| Low | $3–5 | Lower advertiser competition with cost-efficient audience reach. |
| Very Low | Under $3 | Emerging markets with the lowest advertising costs and relatively limited advertiser demand. |
Why Does Facebook Ads CPM Vary by Country?
Facebook Ads CPM is determined through Meta’s advertising auction, meaning advertisers compete for the opportunity to show ads to the same audiences. As a result, advertising costs can vary dramatically from one country to another.
Several key factors influence Facebook Ads CPM by country.
Competitive landscape and market saturation
The level of competition among advertisers within a specific county plays a pivotal role in determining Facebook Ads CPM.
So, countries with highly saturated advertising markets, including the USA, Canada, and Australia, tend to experience higher CPM rates. With numerous advertisers competing for limited ad space, the cost of impressions naturally escalates — especially in mature eCommerce markets where many brands target the same buyers.
User engagement and ad relevance
Now, let’s talk about user engagement and ad relevance. The engagement level of users in a country significantly impacts Facebook Ads CPM.
So, countries with highly engaged user bases, such as Ireland and the United Kingdom, often witness higher CPM rates due to intense competition for user attention. With that said, you must prioritise creating compelling and relevant ad content that resonates with your target audience, leading to increased engagement and potentially lowering CPM through better relevance signals and performance.
Economic factors and purchasing power
And last, economic factors and purchasing power.
So, economic indicators, such as the country’s GDP and purchasing power, exert a notable influence on Facebook Ads CPM. Wealthier nations boasting higher GDP, such as Switzerland and Luxembourg, generally incur higher advertising costs because advertisers are willing to pay more to reach higher-spending audiences.
Conversely, countries with lower GDP, like India and the Philippines, tend to have lower CPM, presenting cost-effective opportunities for advertisers to reach a broader audience — often with different conversion rates and average order values.
How to Benchmark Your Facebook Ads CPM
Benchmarking your Facebook Ads CPM isn’t about achieving the lowest possible cost. Instead, it’s about understanding whether your campaigns are performing competitively within the markets you’re targeting.
Use these best practices to evaluate your CPM more effectively.
Compare against your target country
A CPM that’s considered excellent in one country may be expensive in another.
For example, a $10 CPM may be perfectly normal for campaigns targeting the United Kingdom or Germany, while the same CPM in India or Brazil would be significantly above the local benchmark.
Always compare your CPM against advertisers targeting the same market rather than using a single global average.
Look beyond CPM
A low CPM doesn’t necessarily mean your campaigns are successful.
If your ads generate inexpensive impressions but few clicks or conversions, reducing CPM alone won’t improve profitability.
Evaluate CPM alongside other key performance metrics, including:
- Click-through rate (CTR)
- Cost per click (CPC)
- Conversion rate
- Cost per acquisition (CPA)
- Return on ad spend (ROAS)
These metrics provide a more complete view of campaign performance.
Account for seasonal trends
Facebook Ads CPM changes throughout the year.
Advertising costs typically increase during high-demand shopping periods such as Black Friday, Cyber Monday, Christmas, and other seasonal promotions, when more advertisers compete for the same audiences.
Comparing your December CPM with your July CPM without accounting for seasonality can lead to misleading conclusions. Whenever possible, compare performance against the same period in previous years.
Facebook Ads CPM Benchmark Checklist
Before making changes to your Facebook Ads campaigns, use this checklist to evaluate whether your CPM is truly a concern. Remember that a higher CPM doesn’t automatically mean your campaigns are underperforming. The most effective advertisers evaluate CPM in the context of their market, campaign goals, and overall business results.
Compare your CPM to your country’s benchmark.
Facebook Ads CPM varies significantly by country. Always compare your results with advertisers targeting the same market rather than relying on a global average.
Measure more than just CPM.
Review your click-through rate (CTR), cost per click (CPC), conversion rate, cost per acquisition (CPA), and return on ad spend (ROAS). These metrics provide a much clearer picture of campaign performance.
Consider seasonal trends.
Advertising costs often increase during periods of high demand, such as Black Friday, Cyber Monday, and the holiday shopping season. Compare performance against the same time period whenever possible.
Think about audience competition.
Some audiences naturally cost more to reach. Premium shoppers, high-income consumers, and competitive industries often have higher CPMs, but they can also generate more valuable customers.
Focus on long-term performance.
Avoid reacting to short-term fluctuations. Tracking CPM trends over weeks and months provides more meaningful insights than evaluating a single day’s performance.
For merchants who want to go beyond CPM and benchmark their ad efficiency, TrueProfit’s ROAS benchmark resource tracks how returns vary across industries month by month.
Summing Up: Facebook Ads CPM by Country
There isn’t a universal Facebook Ads CPM that’s considered “good.” The right CPM depends on the country you’re targeting, the level of advertiser competition, your audience, and whether your campaigns are generating profitable results. Use country-specific benchmarks to understand how your advertising costs compare with the market, but don’t evaluate CPM in isolation. Always consider it alongside metrics such as CTR, CPC, CPA, conversion rate, and ROAS to make informed optimisation decisions.
Frequently Asked Questions about Facebook CPM by Country
A good Facebook Ads CPM depends on the country you’re targeting, your industry, campaign objective, and audience. There isn’t a universal benchmark that applies to every advertiser. For example, a CPM of $12 may be competitive in the United States but significantly above average in India. Compare your CPM against country-specific benchmarks rather than relying on a single global average.
A high Facebook Ads CPM is usually caused by increased advertiser competition, targeting highly competitive audiences, seasonal demand, or advertising in markets with high purchasing power. During peak shopping periods such as Black Friday and Christmas, CPMs often increase because more advertisers are competing for the same impressions.
Based on our benchmark data, the United States has the highest Facebook Ads CPM at $16.08, followed by Qatar, Saudi Arabia, the United Kingdom, and Australia. These markets have mature ecommerce industries and high advertiser competition.
India has the lowest Facebook Ads CPM in our benchmark at $1.36, followed by Egypt, Colombia, Chile, and Brazil. While these markets offer lower advertising costs, campaign success should still be measured using metrics such as conversion rate, CPA, and ROAS.
No. A lower CPM simply means you’re paying less to reach 1,000 people. It doesn’t guarantee more clicks, conversions, or revenue. A campaign with a higher CPM may still deliver better results if it reaches a more valuable audience and generates a stronger return on ad spend.
You can often reduce Facebook Ads CPM by improving your ad relevance, refreshing creative assets, broadening overly narrow audiences, testing different campaign objectives, and avoiding periods of unusually high advertiser competition. However, lowering CPM should never come at the expense of campaign profitability.
Review your Facebook Ads CPM regularly and compare it with benchmarks for the countries you’re targeting. It’s also helpful to compare your results against the same period in previous years to account for seasonal changes in advertising costs.
No. CPM is an important indicator of advertising costs, but it should always be evaluated alongside metrics such as click-through rate (CTR), cost per click (CPC), cost per acquisition (CPA), conversion rate, and return on ad spend (ROAS). These metrics provide a more complete picture of campaign performance.