You’re a Shopify owner / marketer. You live in your dashboards. You see a 4x ROAS from your latest TikTok or Meta campaign and feel a spark of hope. But then the doubt creeps in. Was that really a 4x return? Are those ads bringing in new customers, or just reminding people who already love your brand? How much of that success is real, and how much is just the platform taking credit for a sale that was going to happen anyway?
This uncertainty is where millions in ad spend are wasted. But you don’t have to guess. There is a way to find the truth (besides first party tracking).
What is Incrementality, Really?
Incrementality is simply a way to measure the true impact of an action. In e-commerce marketing, it answers one critical question: “Did my ads cause this sale, or would it have happened anyway?” It’s the science of separating real growth from activity that just looks busy. Understanding this is vital because it shifts your focus from vanity metrics to the one thing that matters: incremental profit. It ensures you’re not just buying revenue, but are actually building a more valuable business with every dollar you spend.
How to Find the Truth: The Principle of Testing
To find your true incremental lift, you “have” to run an experiment. The underlying principle is always the same, no matter the method: you need a test group and a control group. The test group sees your ads. The control group does not. The difference in their behavior is the true impact of your advertising. There are two main ways to do this:
- User-Level Tests: You split your audience at the individual user level. This is very precise but can be technically complex and is often reserved for very large brands with dedicated data teams.
- Geo-Based Holdout Tests: You split your audience by geographic location. This is the most practical and accessible method for most e-commerce brands, and it doesn’t have the same privacy hurdles as user-level testing.
For this guide, we’ll focus on the geo-holdout test. It’s your best starting point.
A Step-by-Step Guide to the Geo-Holdout Test
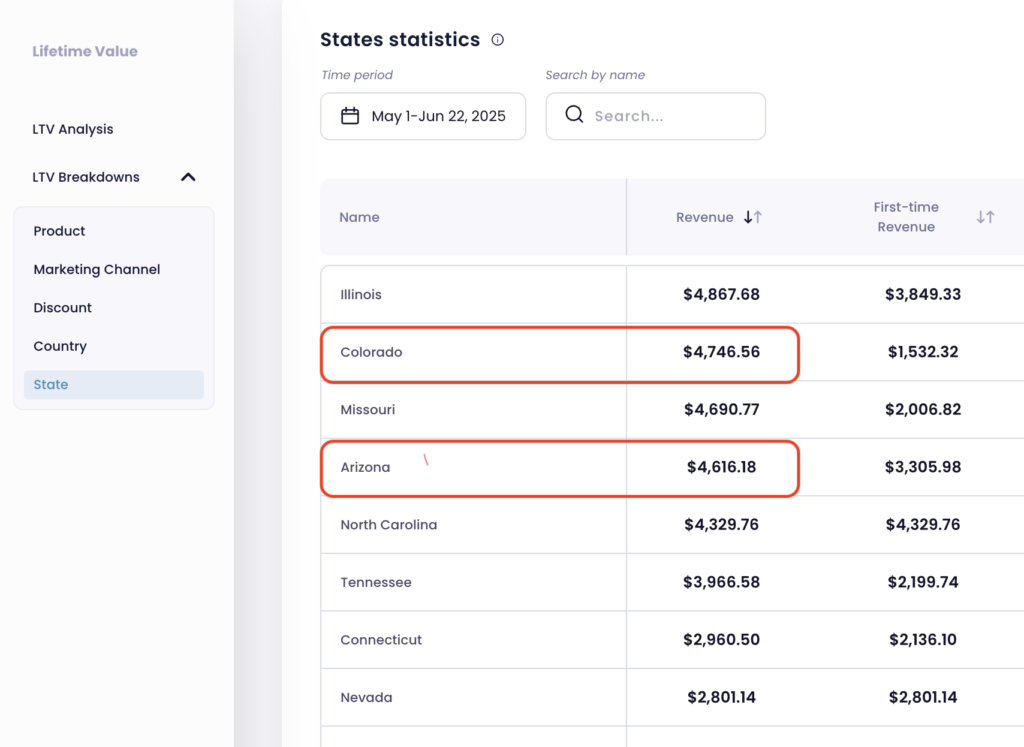
Step 1: Pick Your Playground (Choosing Markets) First, you need two comparable markets. The easiest way is to use two states. Dive into your eComm analytics tool and check Sales by Location report. Look for two states that have had similar sales numbers over the past 3-6 months. Try to pick states with similar population sizes, but historical sales performance is the most important factor. For this example, let’s say you choose Colorado and Arizona.
Step 2: Draw the Line (Setting Up the Campaign) In this test, Colorado will be your “test market” (it sees the ads) and Arizona will be your “control market” (it does not). Go into the ad platform you want to test, let’s say Meta. In your campaign’s ad set, go to the Locations setting. Target the entire United States, but specifically exclude Arizona. Now, your ads will run everywhere in the US except your control market.
Step 3: Let It Run (Test Duration) You need to run this test long enough to get meaningful data. A good starting point is four weeks. This helps smooth out any random weekly sales spikes or dips and gives you a more reliable dataset. Be patient. The goal is to get a clear signal, and that requires time.
Step 4: Do the Math (Measuring the Lift) After four weeks, it’s time to see the results. Go back to your analytics tool (like Lebesgue) and pull the sales revenue from Colorado and Arizona for the test period. The calculation is simple.
Let’s say you got these results:
- Colorado (Test Market) Sales: $55,000
- Arizona (Control Market) Sales: $40,000
The incremental lift from your ads is the difference: $15,000. You now know your ad campaign generated a true, additional $15,000 in sales. This is your ground truth.
From Data to Dollars: 3 Real-World Examples
This number is more than just an interesting fact. It’s a tool for making smart decisions. Here’s how you can put it to work.
1. The “Profitable” Branded Search Dilemma A brand sees a 15x ROAS on their Google Ads campaign for their own brand name. They think it’s their best-performing campaign. After running a holdout test, they discover that 90% of those sales would have happened anyway. The real, incremental ROAS is only 1.5x.
The Action: They slash the budget for branded search ads and reinvest that money into a top-of-funnel Meta campaign that an incrementality test proved was bringing in genuinely new customers.
2. The Meta vs. TikTok Showdown A store spends $10,000 per month on Meta and $10,000 on TikTok. Both platforms report a similar 3x ROAS. They run separate geo-tests on each channel. The results show that the Meta ads produced a strong incremental lift, while the TikTok ads created almost no lift at all.
The Action: They shift the entire TikTok budget over to Meta, effectively doubling down on the channel that is proven to work. Their total sales grow, even though their ad spend stays the same.
3. Scaling Your Winners with Confidence A brand’s main acquisition campaign is performing well. They want to double the budget from $20,000 to $40,000 a month but are afraid of wasting money. They run an incrementality test at the current budget and find it’s highly incremental.
The Action: They scale the budget with the confidence that they are creating new customers, not just hitting a point of diminishing returns. The test turned a risky gamble into a calculated investment.
For Stores Under $20k/Month: Finding Your "Proxy" for Truth
Honestly, formal holdout tests are most effective for brands with larger budgets. Pausing ads in an entire state can be scary when every dollar counts. But that doesn’t mean you have to fly blind. The data you need for a good “proxy” of incrementality is already in your analytics tool. Here are clues to look for:
- Pre/Post Revenue Lift: When you increase spend on a campaign, does your store’s overall revenue see a meaningful lift, or does it stay flat?
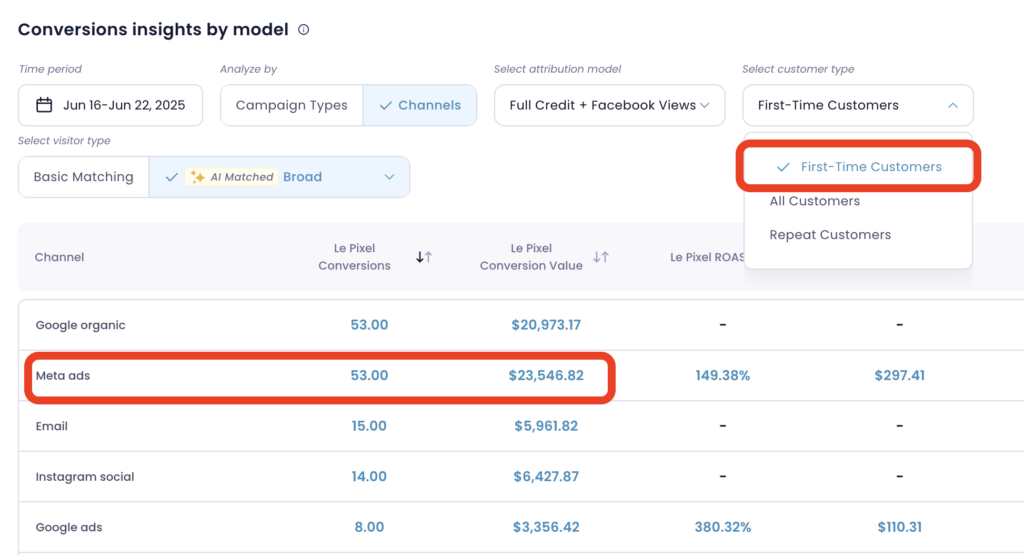
- First-Time vs. Returning Customer Share: When a campaign is running, is the percentage of first-time buyers growing? If so, you are likely creating new demand.
- Paid vs. Organic Trends: If your paid traffic is growing but your total number of purchasers isn’t, you might be paying for customers who would have found you organically.
- Informal Geo-Breakdown: If you are pushing a campaign heavily in California but not New York, and first-time buyers in California grow while New York stagnates, that’s a strong signal of lift without a formal test.
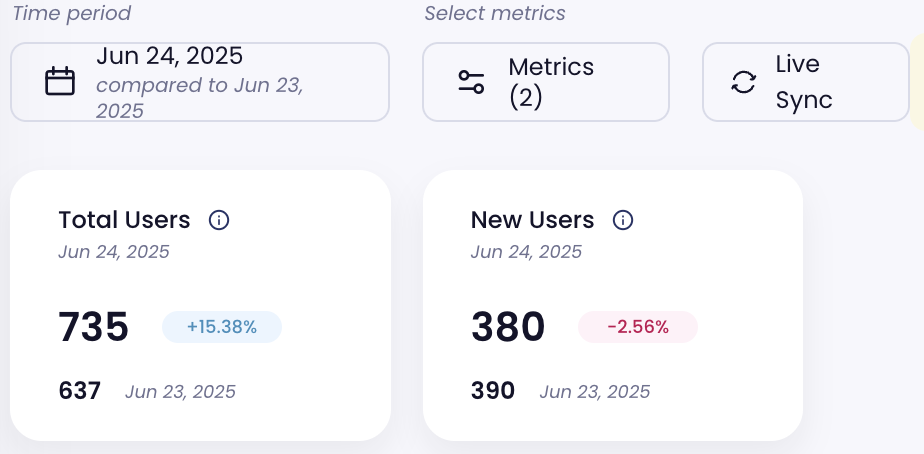
- Daily Trends (Cost vs. New Customers): Look at the days right before and after a campaign launch. If you see a clear jump in first-time customers that holds steady, you’re likely seeing real incrementality.
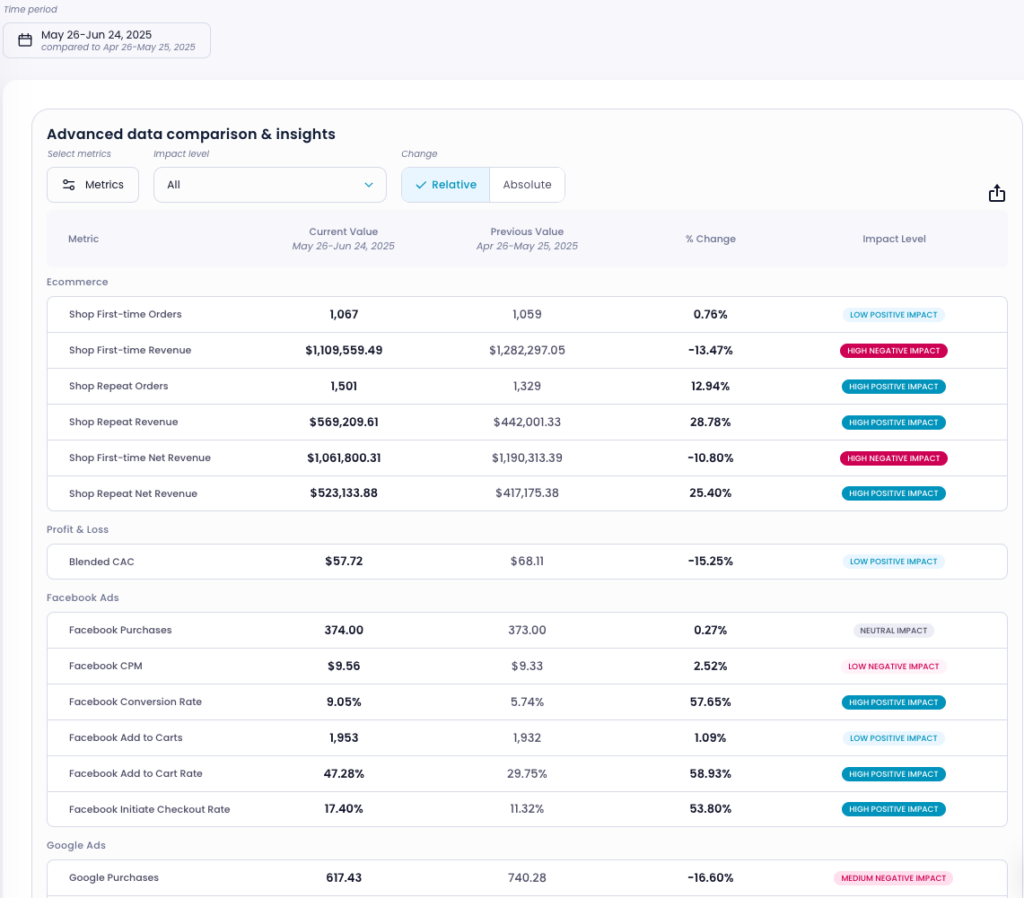
Trying to track all these clues manually is a nightmare. This is exactly why we built the Delta Breakdowns feature in Lebesgue. You don’t have to look at one metric at a time. You can compare any two periods, like before and after a campaign launch, and see the changes across all these data points in one simple, unified view. It does the heavy lifting for you.
Finally, you know if your campaigns are working
The path to smarter growth is about moving from guessing to knowing. It starts by asking the right question: “Is this really working?” Whether you run a full holdout test or use your existing data to find strong clues, the goal is the same. You want to invest your money with the confidence that you are creating real, profitable growth. Basically, the rule of thumb would be:
1. If you’re a <$5k store, track your data for pre/post revenue lifts, first time vs. returning customer share, paid vs. organic trends and daily trends in your analytics tool. It will give you a proxy for incrementality.
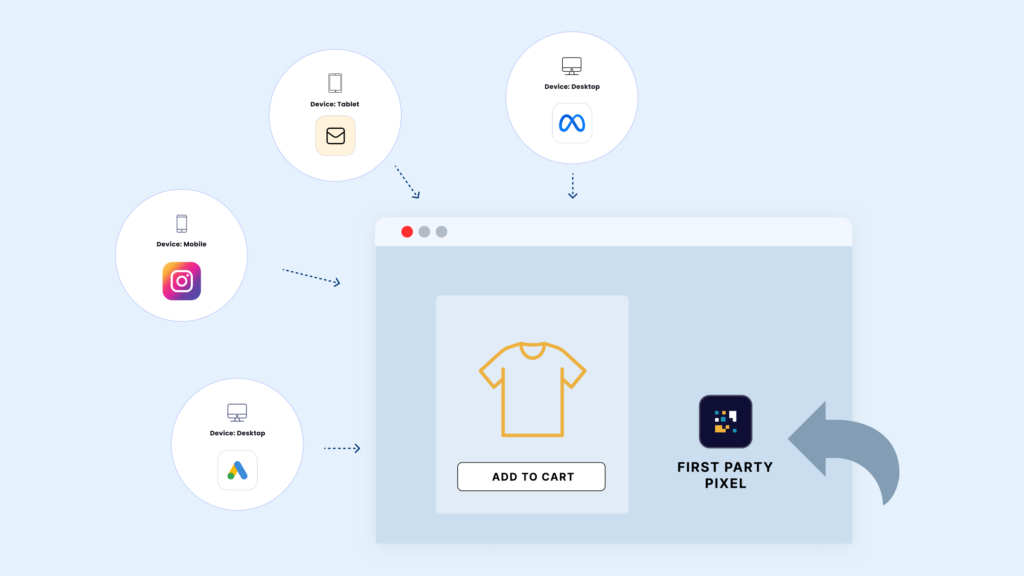
2. If you’re a <$20k store, you can try a first-party pixel (like Le Pixel) and track which channel is truly bringing in these valuable new users
3. If you’re a >$20k store, combine real holdout tests with first-party pixel data to get full picture of your marketing efforts.
Incrementality FAQ'S
What’s the difference between attribution and incrementality?
Attribution assigns credit for a sale to different ad touchpoints. Incrementality proves if the ad actually caused the sale to happen in the first place.
Why is a high ROAS not always a good thing?
A high ROAS can be misleading if it’s just measuring sales that would have happened anyway, like from customers searching directly for your brand.
What is the main principle of an incrementality test?
The core principle is comparing a test group that is exposed to your advertising with a control group that is not. The difference reveals the true impact.
Can I test incrementality on a small budget?
While formal holdout tests are easier with bigger budgets, you can use existing data as a “proxy.” Look at pre/post revenue lift and changes in first-time vs. returning customers when you launch a campaign.