Understanding how your Meta ads campaigns perform is crucial for driving success, but knowing whether your results are truly competitive can be challenging. This is where Meta ads benchmarks come in.
Benchmarks provide industry-specific standards for key metrics like CTR, CPC, and CPM, allowing you to gauge your campaign performance against broader trends. By comparing your results to these benchmarks, you can identify strengths, spot areas for improvement, and make data-driven decisions to refine your advertising strategy.
What are Meta Ads Benchmarks?
Meta ads benchmarks are industry or platform-specific performance standards that help businesses evaluate the effectiveness of their ad campaigns.
These benchmarks represent average metrics such as click-through rate, cost per click, conversion rate, or return on ad spend across various industries, ad formats, or audience types.
By comparing your campaign performance to these benchmarks, you can identify areas where your ads are excelling or falling short.
For example, if your CTR is below the industry average, it may signal the need to improve your ad copy or targeting. Meta ads benchmarks serve as a reference point to set realistic goals, optimize campaigns, and understand how your ads stack up against competitors or market trends.
Why are Meta Ads Benchmarks Important?
As we mentioned before, Meta ads benchmarks are crucial for e-commerce businesses because they provide insights into performance standards and help evaluate the effectiveness of ad campaigns.
Here are key reasons why benchmarks are important:
- Performance comparison: Benchmarks allow store owners to compare their ad performance (e.g., CPM, CTR, ROAS) to industry standards, helping them identify if their campaigns are underperforming or exceeding expectations.
- Budget optimization: By understanding their industry’s typical costs and returns, store owners can allocate budgets more effectively and avoid overspending on underperforming campaigns.
- Strategic insights: Benchmarks reveal trends in ad costs and engagement, enabling e-commerce businesses to adjust their strategies for competitive periods like Black Friday or high-demand seasons.
- Goal setting: Realistic benchmarks help store owners set achievable targets for their campaigns, ensuring their marketing objectives align with industry norms.
- Ad effectiveness: Understanding benchmarks like CPM by country or industry allows store owners to tailor targeting strategies to reach the right audience at a cost-effective price.
In short, Meta ads benchmarks give you insights to make data-driven decisions, optimize campaigns, and maximize profitability.
How to Identify Industry Benchmarks for Your Meta Ads?
Knowing your industry benchmarks is essential for optimizing your Meta ad campaigns, but how can you find the right data to guide your decisions?
The top three ways to identify benchmarks for your e-commerce store are:
- Use analytics and benchmarking tools
- Research industry reports, and
- Analyze competitors.
Use analytics and benchmarking tools
One of the easiest ways to access industry benchmarks is through analytics and specialized tools.
Meta Ads Manager offers insights into your campaign performance, including CPM, CTR, and conversion rates, which you can compare to averages Meta provides for your account.
Additionally, third-party tools like Lebesgue: AI CMO provide detailed benchmark data segmented by industry, country, or ad objective. Benchmarks tools not only show how you’re performing but also give you a clear view of what’s standard for your niche.
Research industry reports
Another reliable source of benchmark data comes from industry reports published by marketing platforms and agencies.
Companies like HubSpot, Hootsuite, and Statista release annual or quarterly reports detailing advertising benchmarks across various industries. These reports typically include metrics like CPC, CPM, and ROAS, giving you a comprehensive overview of what to expect. Meta itself often publishes studies analyzing ad performance trends, which can be especially useful during high-stakes periods like Black Friday.
Analyze competitors
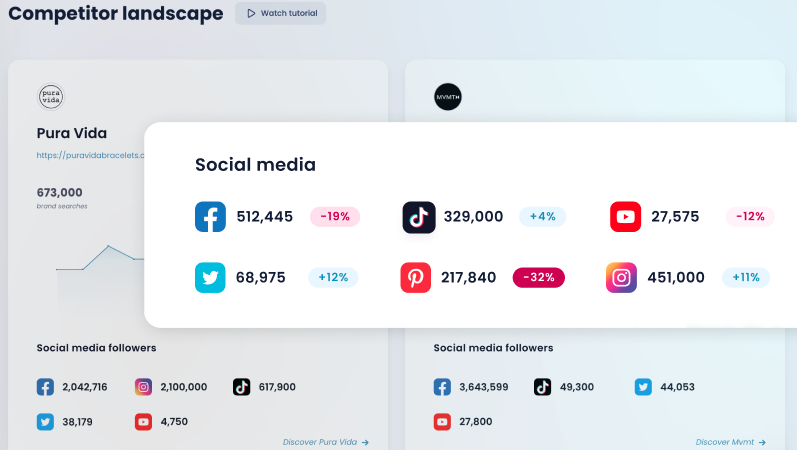
Analyzing your competitors’ ad strategies can reveal valuable benchmark data.
The Facebook Ads Library allows you to view active ads from competitors, helping you estimate their performance based on engagement metrics like likes, shares, and comments.

Market Trends Benchmarks by Lebesgue
Now, let’s explore Meta ads benchmarks by Lebesgue.
In Lebesgue: AI CMO, comparing your campaign metrics like CTR, CR, and CPM for retargeting and prospecting campaigns helps you evaluate their effectiveness.
By analyzing these benchmarks, you can identify areas of improvement and optimize your campaigns to achieve better performance.
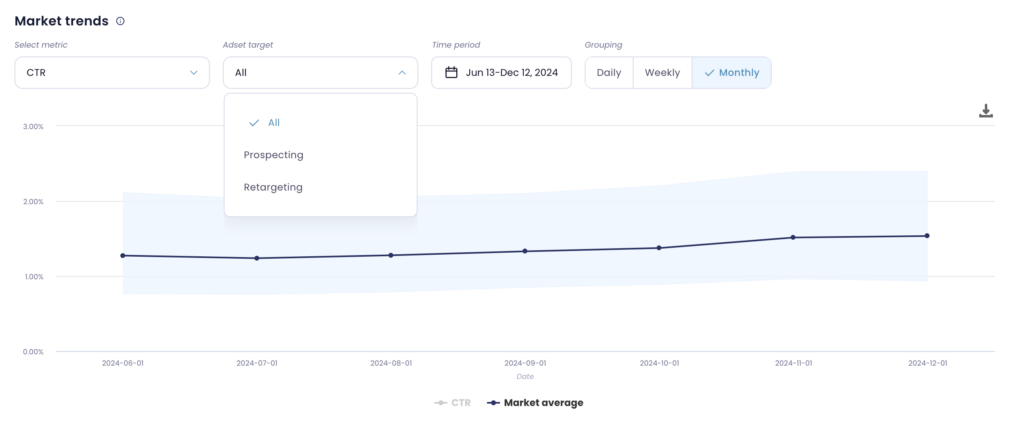
The Market Trends feature offers a comprehensive view of how your advertising performance stacks up against industry trends over time.
By tracking daily, weekly, or monthly changes in key metrics like CPM, CTR, and CR, you gain insights into the evolving landscape of e-commerce advertising. The Lebesgue:AI CMO pulls data from over 1,400 different e-commerce businesses, providing median values for CPM, CTR, and CR that act as reliable benchmarks.
CTR benchmarks for retargeting and prospecting campaigns
CTR Meta ads benchmarks are a critical metric for gauging the effectiveness of your ad creatives and targeting.
In general, retargeting campaigns tend to have a higher CTR because they target users who have already engaged with your brand. These users are more likely to click on ads due to their familiarity with your product or service.
In contrast, prospecting campaigns typically see a lower CTR, as they aim to attract a broader audience who may not be as familiar with your brand.
This makes prospecting campaigns require more compelling creatives and finely-tuned targeting strategies to capture attention and drive clicks.

The graph displays not only the median market values but also highlights the upper and lower 25% bounds in pale blue, giving you a clear visual indication of where your performance falls relative to the market’s top and bottom performers.
CR benchmarks for retargeting and prospecting campaigns
Conversion rate benchmarks are an essential metric for evaluating the success of your campaigns in turning clicks into sales.
Retargeting campaigns generally have higher conversion rates because they focus on individuals who have already interacted with your brand, increasing the likelihood that they will complete a purchase.
On the other hand, prospecting campaigns tend to have lower conversion rates, as they target users who have no prior experience with your brand.
These users often need more time to trust your business and require stronger incentives or nurturing throughout the customer journey to drive conversions.
CPM benchmarks for retargeting and prospecting campaigns
Retargeting campaigns tend to have a higher CPM due to the more specific audience being targeted. Since retargeting focuses on a smaller, more engaged group of users who are already familiar with your brand, there is typically more competition for ad space, raising the cost.
On the other hand, prospecting campaigns usually experience a lower CPM as they cast a wider net, targeting a larger audience. However, while these campaigns are cheaper in terms of reach, they may require more time and resources to convert these users into paying customers.
Funnel Report
Alongside market trends in Lebesgue, you can access your funnel report.
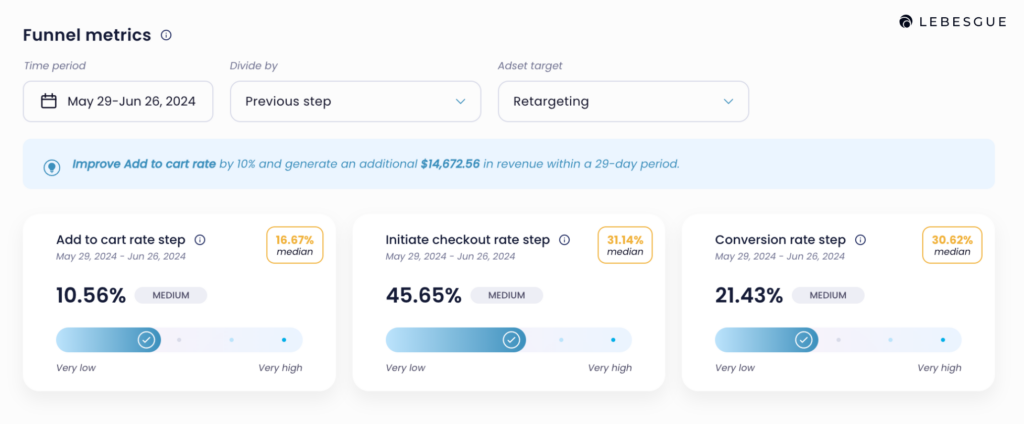
A Funnel Report provides a comprehensive analysis of your customer journey, illustrating how customers interact with your website and identifying where they drop off at critical stages, such as adding an item to their cart, initiating checkout, or completing a purchase.
By breaking down this journey, the report helps you uncover potential barriers preventing users from converting and highlights areas for improvement.
In Lebesgue: AI CMO, the Funnel Report allows you to compare your performance against industry averages, ensuring that your website is performing optimally. This comparison helps identify whether your metrics align with competitive standards or need attention.

Small adjustments, such as optimizing your landing page destination or segmenting audiences based on campaign type, can have a significant positive impact on your store’s performance.
By analyzing and acting on the insights provided in the Funnel Report, you can refine your strategy, reduce drop-off rates, and increase your overall conversion rate.
Meta Campaign Overview Benchmarks
The Campaign Overview section in Lebesgue: AI CMO provides a clear distinction between different ad set targets on Meta, specifically prospecting and retargeting.
By analyzing the performance of each target group, you can easily identify which one is underperforming and may require optimization. This feature allows you to gain a deeper understanding of how each audience segment is responding to your campaigns, helping you make data-driven decisions about where to focus your efforts.
Whether you’re targeting new customers through prospecting or re-engaging past visitors with retargeting, the Campaign Overview helps you pinpoint areas for improvement, ensuring that your campaigns are more efficient and aligned with your goals.
With this insight, you can refine your ad creatives, targeting strategies, and budget allocation to drive better results and maximize ROAS.

Summing Up
Understanding Meta ads benchmarks and how they apply to your ad campaigns is vital for ensuring optimal performance.
By comparing your key metrics such as CTR, CR, and CPM against industry standards, you can gain valuable insights into the effectiveness of your campaigns. Whether you are targeting new prospects or retargeting previous customers, knowing where your metrics stand can highlight areas that need attention or improvement.
Lebesgue: AI CMO makes it easier to track Meta benchmarks and provides actionable data to optimize your campaigns. From analyzing the customer journey through Funnel Reports to understanding how your campaigns measure up against market trends, these insights enable you to fine-tune your strategy and maximize return on ad spend (ROAS).


