If you’re seeking to evaluate the performance of your Google Ads campaigns CTR benchmarks are a great way to do it.
Specifically, by comparing your campaign’s performance against industry benchmarks, you can identify areas for improvement and optimize your strategy for better results.
In this blog post, we’ll be focusing on Google CTR Benchmarks by campaign type, and showing you the latest data.
Additionally, we’ll provide insights and best practices to achieve your marketing goals and maximize your ROI.
So, if you’re looking to make your Google Ads campaigns even better, keep reading to learn more about Google CTR Benchmarks by campaign type.
Knowing Google Benchmarks for Campaign Success
By analyzing industry benchmarks for key performance indicators like click-through rate, cost-per-click, and conversion rate you can gain insights into how your campaigns are performing compared to others in your industry.
This helps you to identify areas for improvement and adjust your strategy accordingly to achieve better results.
Furthermore, by knowing benchmarks you can set realistic goals for your campaigns and determine whether they are performing well or if there is room for improvement.
Another advantage of understanding benchmarks is that they help you identify areas where you may fall behind the competition and adjust your strategy to gain a competitive edge.
With that said let’s explore Google CTR Benchmarks by campaign type.
Google Ads CTR Benchmarks
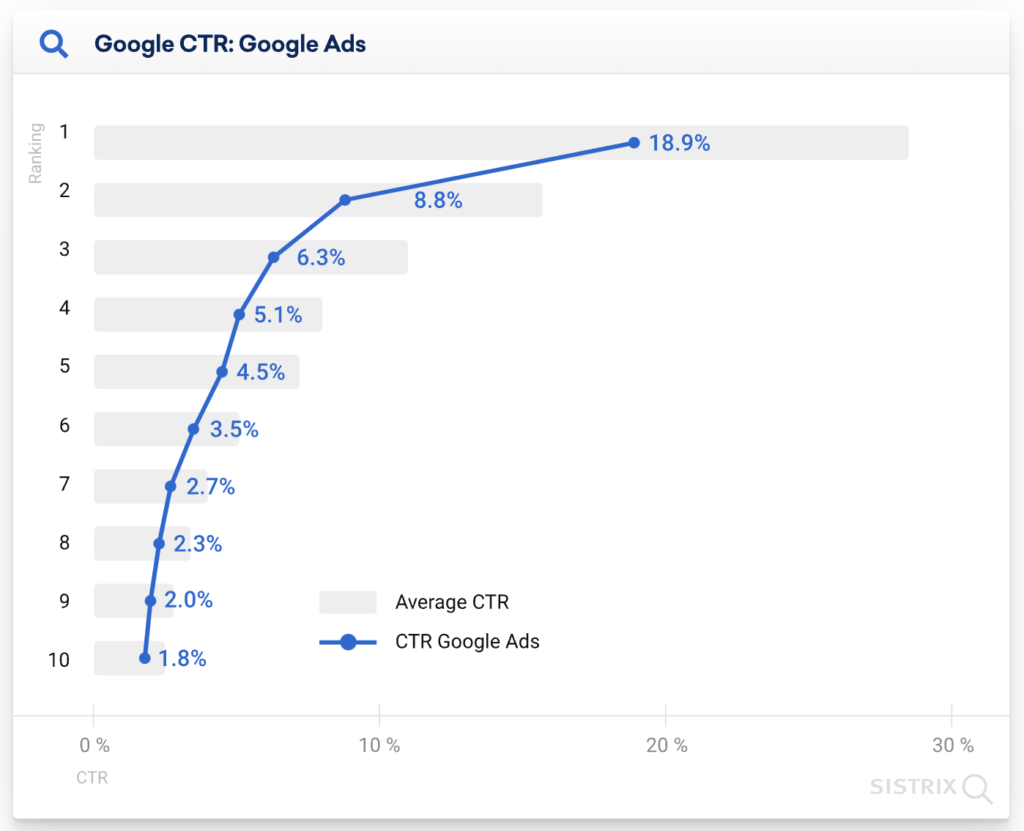
The average CTR for Google Ads is an important benchmark to keep in mind when evaluating the performance of your campaigns.
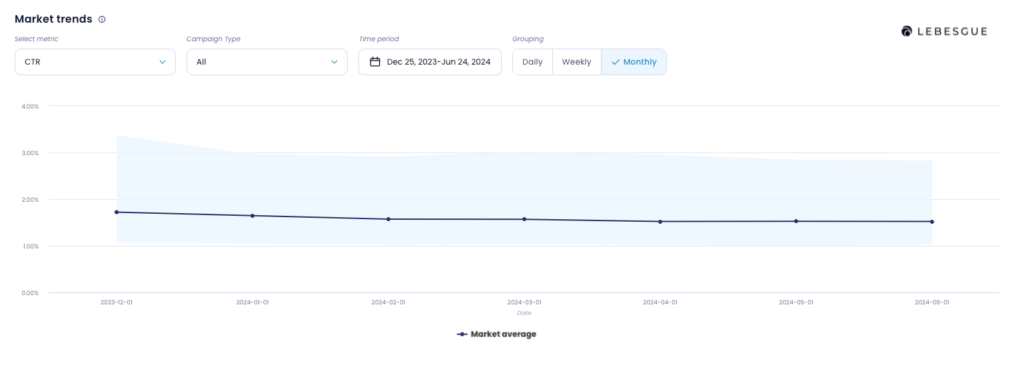
According to our recent data, the average CTR for Google Ads is around 1.52%. This means that for every 100 impressions your ad receives, you can expect to get around 1.52 clicks.
The average CTR can vary significantly depending on various factors such as industry, ad placement, and targeting.
For example, ads with higher ad rank tend to have higher CTR, while ads that are poorly targeted or not relevant to the user’s search query will have a lower CRT.
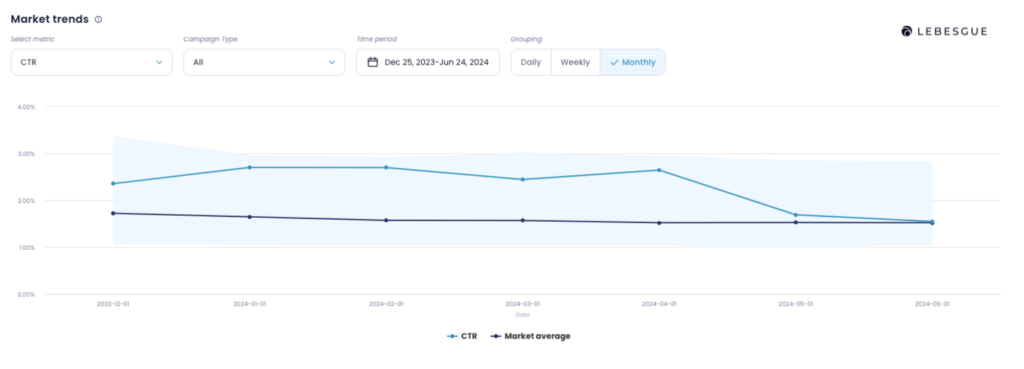
NOTE: In Lebesgue AI CMO you can see your CTR compared to the market average.
By comparing your own campaign’s CTR to the industry average, you can get a sense of how well your ads are performing and whether there is room for improvement.
If your CTR is below the industry average, you may want to consider adjusting your ad copy, targeting, or bidding strategy to make your ads more relevant and compelling to your audience.
After showing CTR for all campaign types, let’s analyze CTR for Search, Shopping, and Performance Max campaigns.
CTR benchmark for Search Campaigns
First, we analyzed the CTR benchmarks for Search campaigns.
According to our data, the average CTR for Search campaigns is 16.76%. In the graph below you can see benchmarks for the last 3 months.
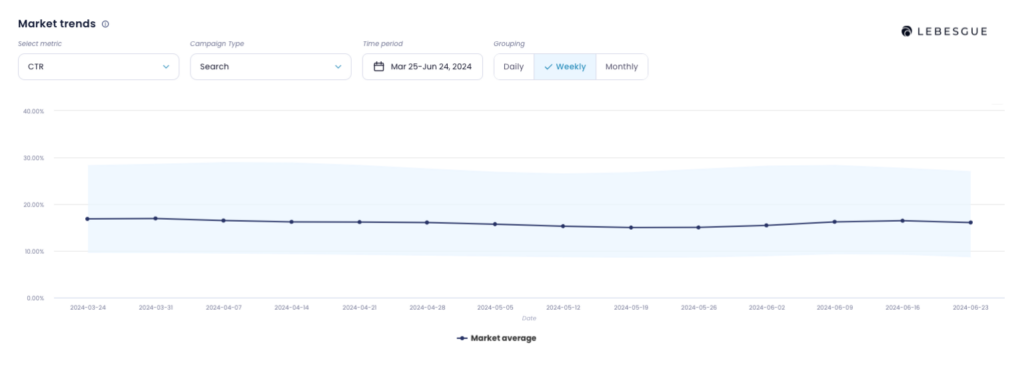
What mean if the benchmark for CTR in a Search campaign is 16.78%?
Well, it means that this is the average CTR achieved by a similar advertiser in your industry. It’s a useful reference point to assess the performance of your own search campaign.
You can compare your CTR against the benchmark to see how well your campaign is doing in terms of generating clicks.
A CTR higher than the benchmark suggests that your ads are performing well, while a CTR lower than the benchmark indicates that your ads need improvement.
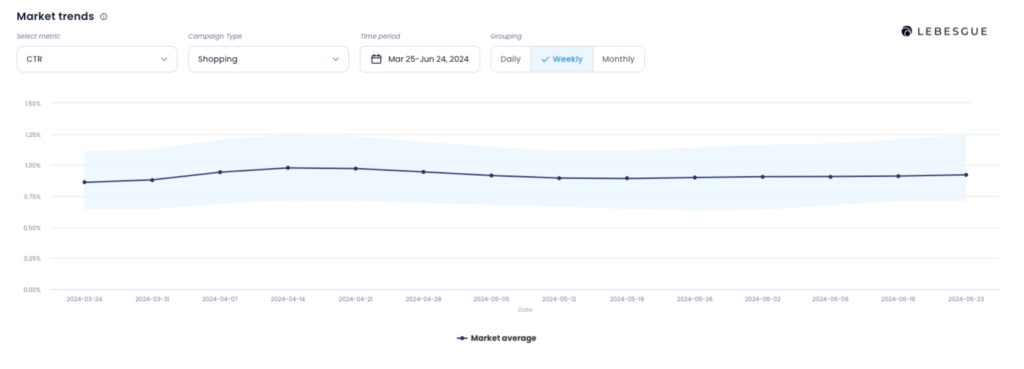
CTR benchmark for Shopping Campaigns
Next, let’s look at how Shopping campaigns are performing.
The average CTR for Shopping campaigns is 0.91%. If we look at the graph, we can see that thought the last three months, CTR for Shopping campaigns is between 0.86% and 0.95%.
Without a doubt, the benchmark CTR for Search campaigns is higher than for Shopping campaigns.
The Search campaigns target users who actively search specific keywords while shopping campaigns target users who are browsing products on Google Shopping.
CTR benchmark for Performance Max Campaigns
And the last CTR that we need to share with you is for the Performance Max campaign. For the last three months, the CTR for the Performance Max campaign was between 1.17% and 1.20%.
Currently, the benchmark CTR for Performance Max is 1.20%

Performance Max campaigns are a type of Google Ads campaign that uses machine learning to automate ad delivery across multiple ad formats and networks.
It’s important to note that Performance Max campaigns are designed to optimize for specific business goals. In this case, CTR is not the most relevant performance metric to focus on.
Instead, it’s recommended to track other key performance indicators that align with your business objectives, such as cost per conversion, return on ad spend, or view-through conversion rate.
By using these KPIs in conjunction with benchmarks and other performance metrics, you can gain a more comprehensive understanding of your Performance Max campaign performance and make data-driven decisions to optimize your ad spend.
What is good CTR for Google Ads?
It’s hard to answer this question with a simple answer because a good CTR depends on your industry and the type of campaign you’re running. As discussed in this blog post, different campaign types yield different CTR expectations.
If we look at all Google Ads campaigns, a good CTR generally falls between 1.03% and 2.82%. However, knowing what CTR you can expect for each campaign type is crucial.
The campaign type that typically achieves the highest CTR is the Search campaign. For Google Search campaigns, a good CTR is between 9.17% and 27.89%.
Next is the Performance Max (PMax) campaign. Here, you can consider having a good CTR between 0.81% and 1.82%.
Lastly, we have Shopping campaigns. The good CTR for Shopping campaigns is between 0.67% and 1.17%.
Summing Up
And that’s it. If you know your CTR benchmarks you can compare the performance of your Google Ads campaigns against industry averages.
By doing so, you can identify areas where your campaigns are underperforming and make data-driven decisions.
Also, CTR benchmarks help you set realistic goals for your campaigns. Additionally, understanding benchmarks can help you identify areas where you may fall behind the competition and adjust your strategy accordingly to gain a competitive edge.