In our previous blog posts, we delved into the interesting aspects of Facebook Ads CPM based on gender and industry, uncovering valuable insights into the ever-evolving world of Facebook advertising. Today, we continue our exploration by diving into the analysis of Facebook Ads CPM by country.
Join us as we uncover the impact, provide in-depth analysis, and reveal the exciting opportunities that exist within the realm of CPM rates across different countries.
Factors Influencing Facebook CPM by Country
At the beginning let’s see what exactly influences Facebook CPM by country. When it comes to Facebook Ads CPM, understanding the factors that influence these rates becomes the key for eCommerce advertisers seeking effective campaign optimization.
So, let’s dive deep into the elements that contribute to the variation in Facebook CPM by country.
Competitive landscape and market saturation
The level of competition among advertisers within a specific county plays a pivotal role in determining Facebook Ads CPM.
So, countries with highly saturated advertising markets, including the USA, Canada, and Australia, tend to experience higher CPM rates. With numerous advertisers competing for limited ad space, the cost of impressions naturally escalates.
User engagement and ad relevance
Now, let’s talk about user engagement and ad relevance. The engagement level of users in a country significantly impacts Facebook Ads CPM.
So, countries with highly engaged user bases, such as Ireland and the United Kingdom, often witness higher CPM due to intense competition for user attention. With that said, you must prioritise creating compelling and relevant ad content that resonates with your target audience, leading to increased engagement and potentially lowering CPM.
Economic factors and purchasing power
And last, economic factors and purchasing power.
So, economic indicators, such as the country’s GDP and purchasing power, exert a notable influence on Facebook Ads CPM. Wealthier nations boasting higher GDP, such as Switzerland and Luxembourg, generally incur higher advertising costs.
Conversely, countries with lower GDP, like India and the Philippines, tend to have lower CPM, presenting cost-effective opportunities for advertisers to reach a broader audience.
The Analysis of Facebook Ads CPM by country
And last, economic factors and purchasing power.
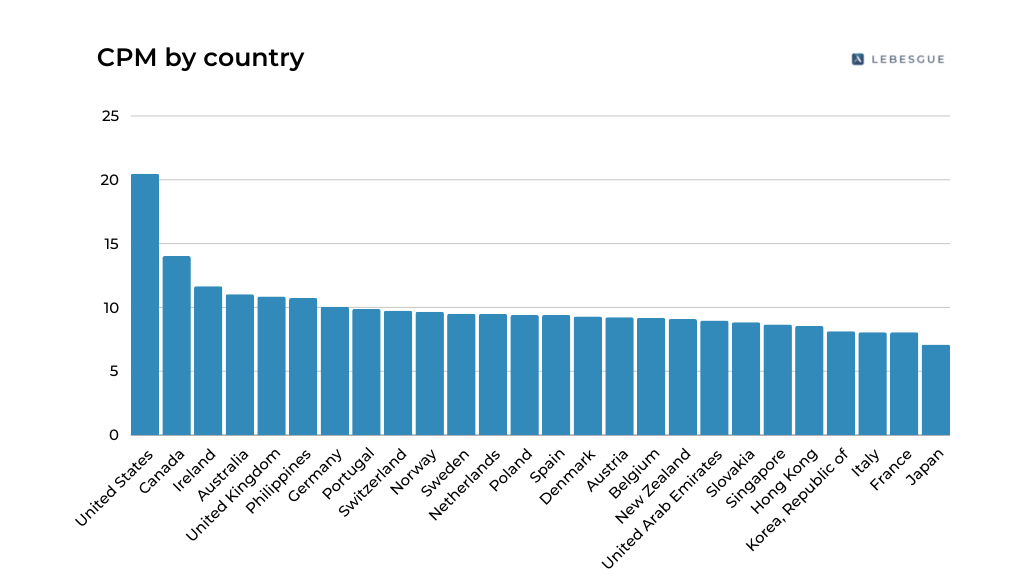
The analysis of Facebook Ads CPM by country reveals interesting insights into the variations in advertising costs across different countries.
The United States takes the lead with a CPM of $20.48, showcasing the highest advertising costs. This can be attributed to the fiercely competitive advertising landscape and the saturation of the market on the platforms.
Conversely, countries with lower GDP, like India and the Philippines, tend to have lower CPM, presenting cost-effective opportunities for advertisers to reach a broader audience.
NOTE: In Lebesgue AI CMO you can compare your CPM with industry average and see how your campaigns compare to the competition.
Canada and Australia also exhibit relatively high CPM rates, with values of $14.11 and $11.04 respectively. These countries boast competitive advertising environments and well-established markets, contributing to the higher costs of impressions.
Across various European countries such as Austria, Belgium, Switzerland, Germany, and the United Kingdom, CPM rates range from $9.18 to $10.05. These nations demonstrate moderate to high advertising costs, driven by factors like competitive landscapes, higher purchasing power, and engaged user bases.
Asian countries like Japan, Korea Republic, and Singapore showcase CPM rates ranging from $7.09 to $8.66. These countries have well-developed economies and a significant number of advertisers competing for ad space, resulting in relatively higher costs.
On the other hand, developing countries like India, Chile, and Mexico exhibit lower CPM rates ranging from $1.77 to $5.54. These nations present cost-effective opportunities for advertisers, as there is less competition and comparatively lower purchasing power.
Here are the Facebook CPM breakdown by country for eCommerce in 2024:
- United States: $20.48
- Canada: $14.03
- Austria: $9.24
- Australia: $11.04
- New Zealand: $9.09
- United Kingdom: $10.85
- Luxembourg: $7.22
- Netherlands: $9.49
- Ireland: $11.66
- Denmark: $9.29
- Germany: $10.05
- Finland: $6.87
- Sweden: $9.51
- Japan: $7.09
- Switzerland: $9.75
- Israel: $6.09
- Belgium: $9.18
- Norway: $ 9.67
- Republic of Korea: $8.13
- Hong Kong: $8.55
- Singapore: $8.66
- France: $8.05
- Hungary: $5.11
- Spain: $9.41
- Italy: $8.06
- Portugal: $9.88
- United Arab Emirates: $8.98
- Greece: $4.14
- Slovenia: $3.81
- Croatia: $5.07
- Malaysia: $3.60
- Philippines: $10.73
- Mexico: $5.54
- India: 2.7
Optimizing Campaigns Based on Market Dynamics
But, how can you use this data in your campaign optimization?
Well, the analysis of Facebook Ads CPM by country uncovers a range of opportunities for campaign optimization. While countries with high CPM rates pose a challenge in terms of advertising costs, they also indicate a market with engaged audiences.
This is an opportunity for creating compelling ad content and targeting specific audience segments to maximize your return on investment.
On the other hand, countries with lower CPM rates present cost-effective opportunities for reaching a wider audience within your budget constraints. These countries may have emerging markets, growing user bases, or untapped advertising potential.
This opens up an opportunity to experiment with different ad formats, creative strategies, and audience targeting to achieve high visibility and engagement at a lower cost.
Additionally, international eCommerce advertisers can use the variations in Facebook Ads CPM by country to expand their reach and diversify their customer base.
By identifying countries with favorable CPM rates and aligning them with your target market and business objectives, you can strategically allocate your resources and tap into new markets.
Summing Up: Facebook Ads CPM by Country
And that’s it! We hope that this in-depth analysis of Facebook Ads CPM by country has provided you with valuable insights that can truly impact your advertising strategies. The data reveals the differences in Facebook Ads CPM rates among various countries.
However, these numbers represent a quick overview of CPM benchmarks by country, and it’s essential to consider other factors like how you target your ads, the size of your audience, and the goals of your campaign for a complete assessment.