If you’re actively running Facebook ads, the term “CTR” probably rings a bell. Click-through rate, or CTR, stands as a key metric that tells you how many people who laid eyes on your Facebook ads took that decisive step and clicked on them, thereby interacting with your content. Yet, even armed with this data, it’s not always straightforward to gauge whether your CTR, as measured against Facebook Ads CTR Benchmarks, falls within the realm of the ordinary or if there’s room for improvement.
Is your CTR in line with industry standards, such as the Facebook Ads CTR Benchmarks? Does it surpass the industry average, indicating a competitive advantage? Before we jump to conclusions, let the data lead the way.
Why CTR Matters
While it might seem like just another statistic, the significance of CTR is important for several reasons, making it a metric you can’t afford to overlook.
Measuring engagement and relevance
As we said before, CTR tells you how well your ads capture your audience’s attention and resonate with their needs. A higher CTR reflects not only clicks but also engagement. When users willingly click on your ad, it indicates a level of interest and relevance that goes beyond mere impressions.
Essentially, CTR measures how effectively your message aligns with your audience’s preferences and prompts them to take action.
Assessing ad effectiveness
Your campaign’s ultimate goal is to drive action, whether it’s visiting your website, signing up for a newsletter, or making a purchase. CTR acts as a preliminary indicator of whether your ads are moving in the right direction. If your CTR is low, it might be time to reconsider your ad’s copy, visuals, or targeting to boost its appeal and effectiveness.
Cost efficiency and budget optimization
Beyond engagement, CTR has a role in optimizing your ad budget. A higher CTR can lead to a lower CPM, meaning you’re getting more clicks for your advertising budget.
This efficiency can allow you to stretch your budget further, maximizing your reach and impact without necessarily increasing spending.
Insights for improvement
CTR isn’t just a static figure; it’s a dynamic metric that evolves with your campaigns. Monitoring CTR over time provides valuable insights into what’s working and what’s not. If you see a decline in CTR, it might be an indicator that your ads need refreshing, your audience targeting needs refinement or your messaging needs adjustment.
Conversely, a rising CTR can highlight successful strategies that you can replicate in future campaigns.
Benchmarking against industry standards
One of the most compelling aspects of CTR is its ability to provide context. By comparing your CTR to industry benchmarks, you gain a sense of where you stand in your industry.
Are you outpacing your competition, or is there room for improvement? This context helps you set realistic goals and aspirations for your campaigns.
Analysis of Facebook Ads CTR Benchmarks
With a clear understanding of what CTR is and its significance, let’s now shift our focus to the analysis of Facebook Ads CTR benchmarks.
In this part of the blog post, we’ll explore the average CTR for both prospecting and retargeting campaigns, CTR benchmarks segmented by gender, and CTR trends across various countries.
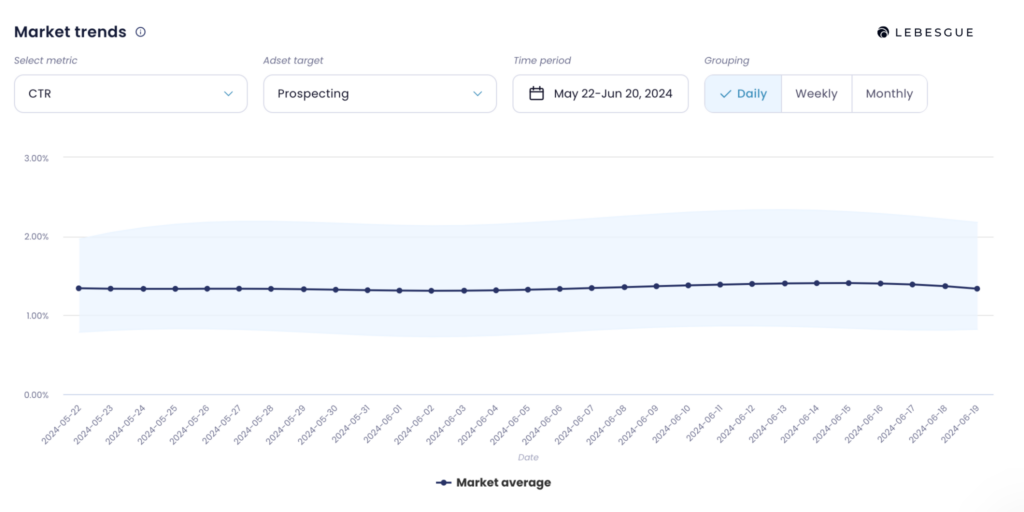
Facebook ads CTR benchmarks by campaign type
When we look at how audiences interact with ads, the type of campaign you run makes a big difference. Here’s what the numbers show:
for prospecting campaigns, the CTR is about 1.34%, while for retargeting campaigns, it’s a bit lower at 1.0%.
This might seem a bit surprising, but it tells us something important about these campaigns.
Prospecting campaigns are all about reaching new people who might not know much about your brand or what you offer. Because of this, their CTR tends to be a bit lower.
On the other hand, retargeting campaigns target users who have already shown some interest in your brand. Because of this existing interest, their CTR is a bit lower compared to prospecting campaigns.
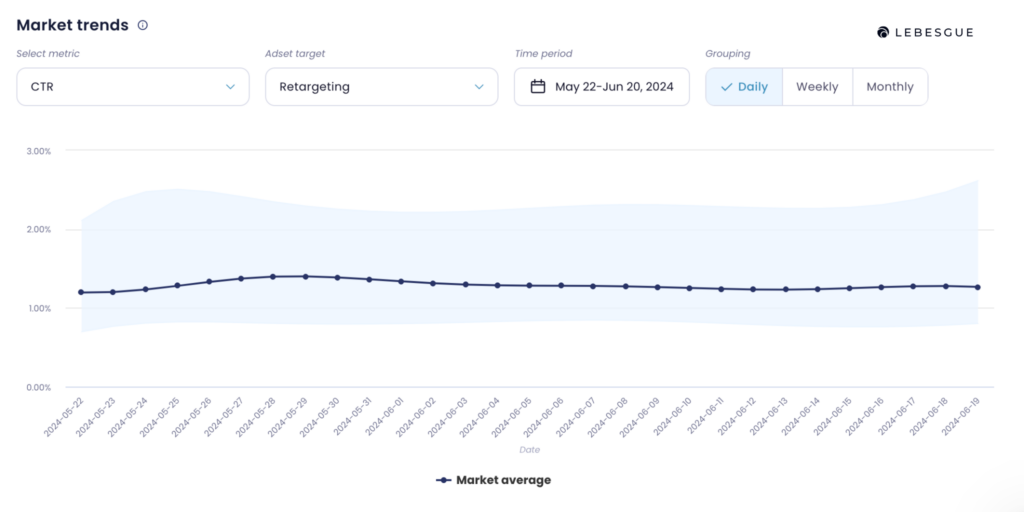
NOTE: In Lebesgue AI CMO, you can compare your CTR with industry benchmarks to see how you stack up against the competition.
In simpler terms, when you’re trying to introduce your brand to new people, the CTR tends to be a bit better.
But when you’re showing ads to people who already know about you, the CTR can be slightly lower.
Facebook ads CTR benchmarks by audience
When we consider audiences based on gender, a distinct pattern emerges. Ads that are specifically targeted at male audiences tend to exhibit a significantly lower CTR, both for prospecting and retargeting campaigns.
However, this trend varies based on whether the audience is within or outside of the United States.
In the United States, when targeting male audiences with prospecting campaigns, the CTR stands at 1.3%, while for female audiences, it’s slightly lower at 1.2%. This suggests that prospecting campaigns are more effective at engaging male audiences in the USA.
When it comes to retargeting campaigns within the USA, the CTR for male audiences drops to 0.75%, while for female audiences, it’s slightly higher at 0.9%. This indicates that retargeting campaigns tend to yield a more favorable CTR among female audiences within the USA.
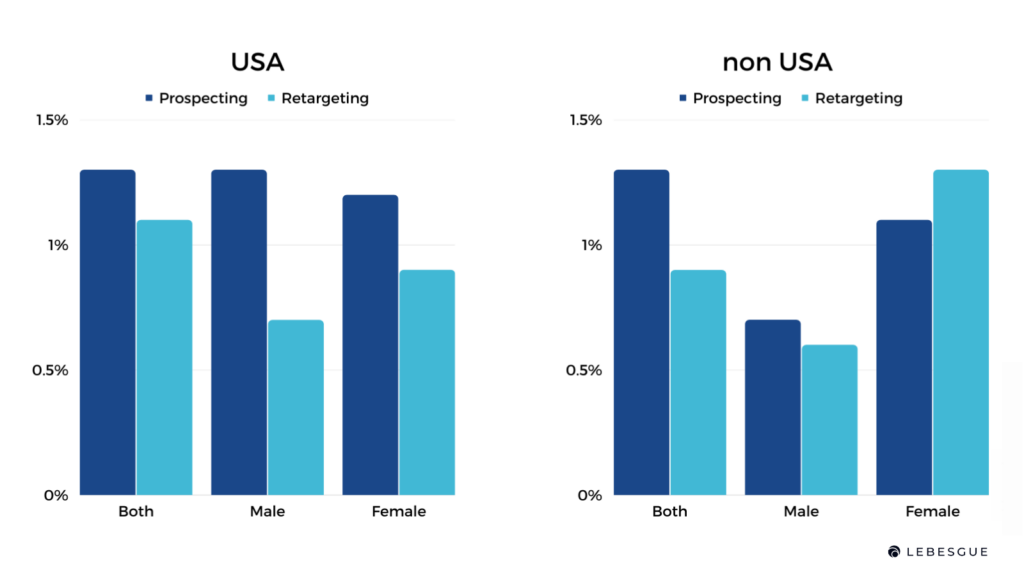
The dynamics shift when we consider audiences outside of the United States. For prospecting campaigns, the CTR for male audiences drops to 0.7%, whereas for female audiences, it sees an increase of 1.3%. This suggests that, outside the USA, female audiences are more engaged by prospecting campaigns.
Similarly, in retargeting campaigns outside the USA, the CTR for male audiences remains lower at 0.6%, while for female audiences, it’s slightly higher at 1.2%. This reinforces the trend of female audiences being more responsive to retargeting campaigns in international settings.
Facebook ads CTR benchmarks by country
Among the diverse array of countries, Cyprus stands out as a standout performer in the realm of prospecting campaigns, boasting a higher CTR. This suggests that the audiences in Cyprus are particularly receptive to new and unfamiliar content, making them prime candidates for prospecting campaigns.
On the flip side, when it comes to retargeting campaigns, Greece takes the spotlight with a higher CTR. This implies that audiences in Greece, who have already interacted with a brand, show keen interest in revisiting and engaging further with the content they’re familiar with.
What makes this analysis even more intriguing is the comparison of CTR between prospecting and retargeting campaigns across various countries. In some instances, there’s a notable deviation from the expected pattern. Countries such as Greece, Singapore, Poland, Norway, Slovenia, Japan, Mexico, and Croatia demonstrate a higher CTR in retargeting campaigns than in prospecting campaigns.
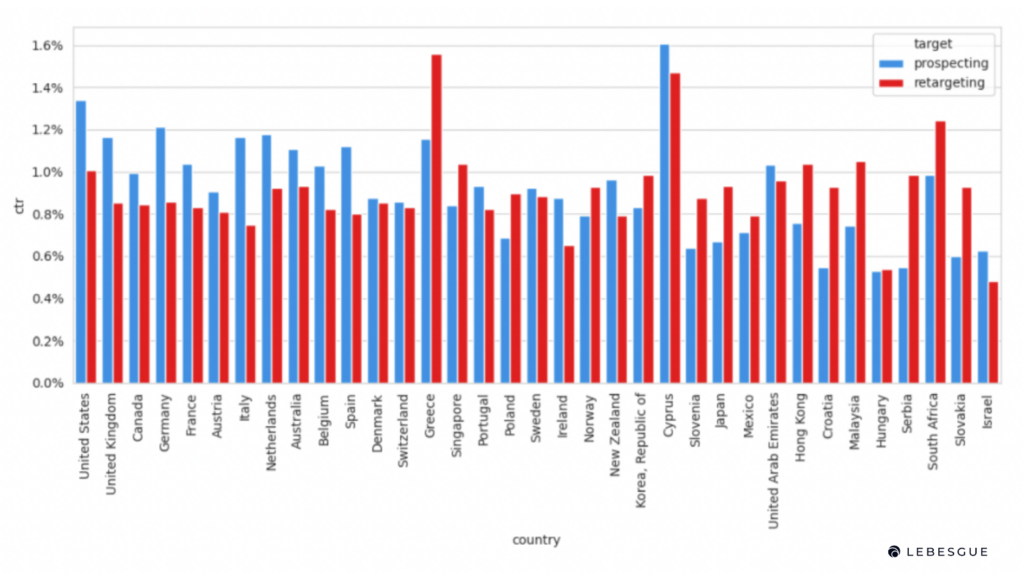
NOTE: In Lebesgue AI CMO, you can compare your CTR with industry benchmarks to see how you stack up against the competition.
The Good CTR for Facebook Ads
Now that we’ve explored the Facebook Ads CTR Benchmarks, let’s address the question that’s likely been on your mind: What constitutes a “good” CTR? The answer isn’t as straightforward as a single number, as it’s influenced by a medley of factors.
A “good” CTR isn’t a one-size-fits-all metric; rather, it’s a metric that needs to be understood within the context of your specific campaigns. The benchmarks we’ve explored provide a valuable reference point, but it’s essential to consider your industry, campaign goals, target audience, and geographic location.
Well, if your CTR is higher or kind of close to those averages, that’s a good sign. Let’s break it down:
For prospecting campaigns, a good CTR is considered between 1% and 1.35%.
In retargeting campaigns, you can expect a little lower CTR than in your prospecting campaigns. So, the good CTR for a retargeting campaign is between 0.9% and 1.23%.
Summing Up
And that’s it! We’ve gone through all the important numbers when it comes to Facebook Ads CTR benchmarks.
If you’re not quite happy with how your current CTR is looking, don’t worry. We’ve got you covered with some practical tips that you can put into action to boost your Facebook Ads CTR.