Google Ads benchmarks for Shopify stores provide performance metrics that help you assess your advertising effectiveness compared to similar businesses.
If you’re running Google Ads for your Shopify store, it’s crucial to understand how your campaigns perform compared to your competitors. Benchmarks provide valuable insights into whether your campaigns align with industry trends or need further optimization.
In this blog post, we’ll explore how to identify your Google Ads benchmarks and how to use that data effectively.
Google Ads Benchmarks for Shopify Stores
Google Ads benchmarks for Shopify stores refer to standard performance metrics used to evaluate the effectiveness of ad campaigns.
These benchmarks provide average values for key metrics like:
- click-through rates (CTR),
- cost per click (CPC),
- conversion rates, and
- return on ad spend (ROAS).
They help Shopify store owners compare their campaign performance against industry standards, identify trends, and uncover opportunities for optimization.
Benchmarks are typically categorized by campaign types, such as Search Ads, Shopping Ads, or Performance Max, and are influenced by factors like industry, target audience, and competition.
In the next section of this blog post, we’ll break down Google Ads benchmarks by campaign type to help you better understand how each performs.
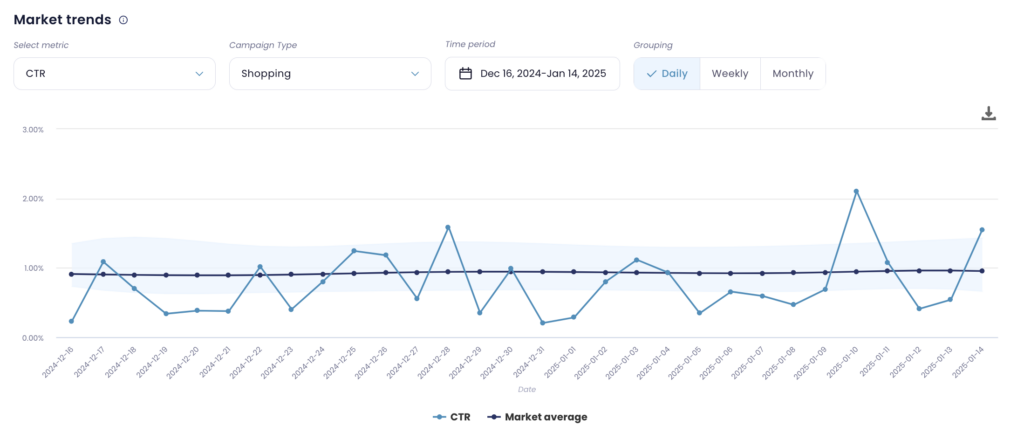
Additionally, you can find real-time Google Ads benchmarks in Lebesgue: AI CMO, and we’ll show you how to use this feature to optimize your campaigns.
Google Ads Benchmarks for Shopping Campaigns
Shopping campaigns on Google Ads are an effective way for Shopify stores to showcase their products directly in search results, making it easier for potential customers to discover and purchase items.
The benchmarks for Shopping campaigns for Shopify stores are:
- CTR: 0.93%
- Conversion Rate (CR): 1.86%
- CPC: $0.63


When you have your industry benchmarks for Google Ads Shopping campaigns and your own performance data, here are the key areas to focus on:
Click-through rate
Compare your CTR to the industry benchmark. If your CTR is lower than the benchmark, it suggests your ads are not engaging enough, and you might need to improve your product feed, ad copy, or targeting.
Cost per click
If your CPC is higher than the benchmark, it could indicate that your ads are less competitive or that your bids are too high.
Conversion rate
If your conversion rate is below the benchmark, it indicates that while you’re driving traffic to your site, you’re not converting enough visitors into customers.
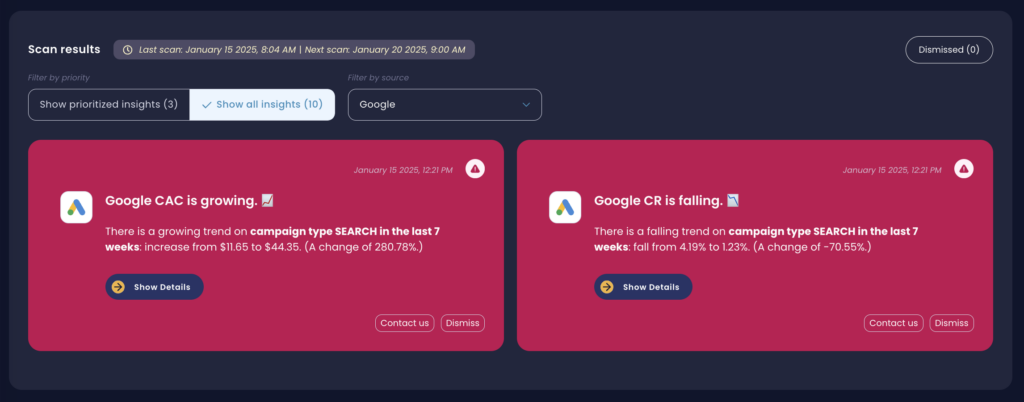
Or, we can save you the trouble and help you analyze your numbers. Lebesgue detects the metrics that need improvement and provides actionable tips and insights on how to enhance them.

Google Ads Benchmarks for Search Campaigns
Search campaigns are a popular choice for Shopify stores, offering a highly effective way to drive targeted traffic. For search ads, the average benchmarks for Shopify stores are as follows:
- CTR: 15.15%
- CPC: $0.64
- CR: 2.31%
These numbers indicate that search ads tend to have a high engagement rate, with a relatively low cost per click, making them a powerful channel for attracting customers.
To maximize the effectiveness of your search campaigns, it’s important to regularly analyze these benchmarks.
If your CTR or CR is lower than the benchmarks, it may be time to optimize your keywords, ad copy, or landing pages.
Conversely, if your CPC is higher than expected, you may need to refine your bidding strategy or assess your competition to ensure your ads remain cost-effective.

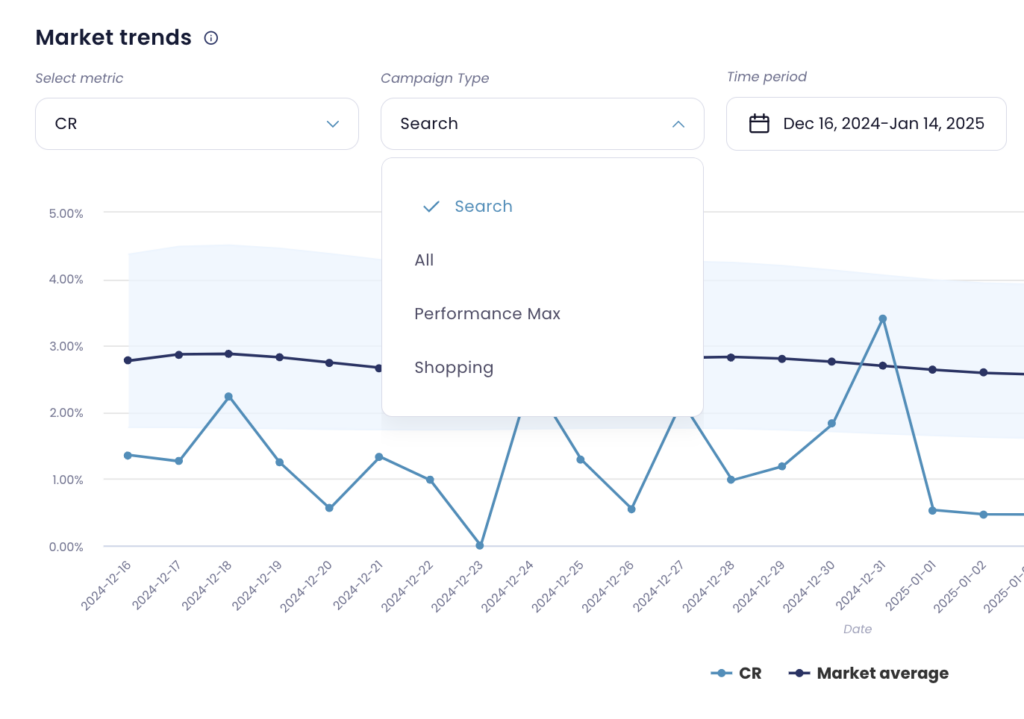
You can also find search campaign benchmarks in Lebesgue: AI CMO. Simply break down the data by search campaign type and choose the time period you want to analyze.
This will give you real-time insights to compare your performance with industry standards and identify areas for optimization.
Google Ads Benchmarks for Performance Max Campaigns
For Performance Max campaigns, Shopify stores can expect the following average benchmarks:
- CTR: 1.33%
- CPC: $0.23
- CR: 1.69%
These numbers indicate that Performance Max campaigns tend to have a lower cost per click and a modest click-through rate compared to other campaign types. While this may mean lower engagement per click, the broad targeting capabilities of Performance Max campaigns can help generate diverse customer interactions.
To get the most from these campaigns, it’s crucial to analyze how your metrics compare to these benchmarks.
If your CTR or CR is lower than expected, consider refining your targeting, ad creatives, or optimization settings. If your CPC is higher than the benchmark, you might need to adjust your bidding strategy to stay competitive.
How to know on which metrics to focus to improve?
When you have Google Ads benchmarks for your campaigns, here’s how to identify the areas that need attention:
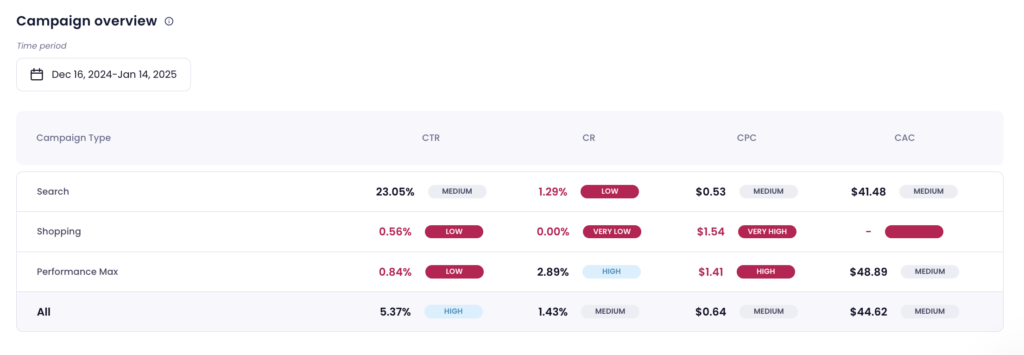
Start by comparing your campaign’s key metrics—CTR, CPC, and CR—against the industry benchmarks for your specific campaign type, whether it’s Shopping, Search, or Performance Max.
If your metrics exceed the benchmarks, you’re on the right track! This means your campaigns are performing well in those areas, and you can further optimize or allocate more budget to maximize these strengths.
If your metrics fall below the benchmark, it’s a sign that there’s potential for improvement. Focus on those areas to enhance your performance.
With the right data, you can easily compare your campaigns to industry standards and pinpoint where improvements are needed. It’s much easier to spot trends and areas for optimization when all your campaigns and benchmarks are in one place, allowing you to take action quickly.

How Lebesgue: AI CMO can help me with Google Ads benchmarks analysis?
Lebesgue: AI CMO is highly effective for analyzing Google Ads benchmarks because it simplifies the process of comparing your performance with industry standards. Here’s why:
Centralized Insights: It brings all your campaigns together in one place, alongside real-time benchmarks, so you can easily see how your ads compare across metrics like CTR, CPC, and CR.
Actionable Recommendations: Lebesgue doesn’t just provide benchmarks—it identifies underperforming areas and offers practical, data-driven suggestions to improve your campaigns.
Customizable Analysis: You can break down benchmarks by campaign type (e.g., Shopping, Search, Performance Max) and choose specific time periods to analyze trends over time.
Efficiency: Instead of manually researching or analyzing metrics, Lebesgue streamlines the process, saving time and helping you focus on making impactful optimizations.
It’s comprehensive software that turns benchmark data into actionable insights, helping you make informed decisions to improve your ad performance.
Summing Up
Google Ads benchmarks provide a reference point to evaluate your campaign’s performance by comparing key metrics like CTR, CPC, and CR against industry averages.
By analyzing these benchmarks, you can identify where your campaigns are exceeding expectations or where improvements are needed. Tracking trends and regularly comparing your results helps ensure your ads remain competitive and aligned with industry standards.


