How much do Facebook ads cost? Which Facebook placement or audience is the most expensive one? How can you reduce your CPM? Read on to find the answers and learn what we’ve found about CPM benchmarks after analyzing more than 1000 different ad accounts.
What is Facebook CPM?
CPM stands for Cost per 1,000 Impressions, which is essentially the amount of money Facebook charges you to show your ads to a thousand people.
CPM = Amount Spent / Number of Impressions x 1000
This metric is calculated as the total amount spent on an ad campaign, divided by impressions, and multiplied by 1,000. So for example, if you had spent $50 and got 10,000 impressions, your CPM would have been $5.
What Determines the CPM?
There are multiple factors that can raise or lower the CPM, such as:
- Seasonality
- Audience targeting (size and location)
- Relevance score,
- Placement selection,
- Ad creative (video vs images),
- Ad frequency, etc.
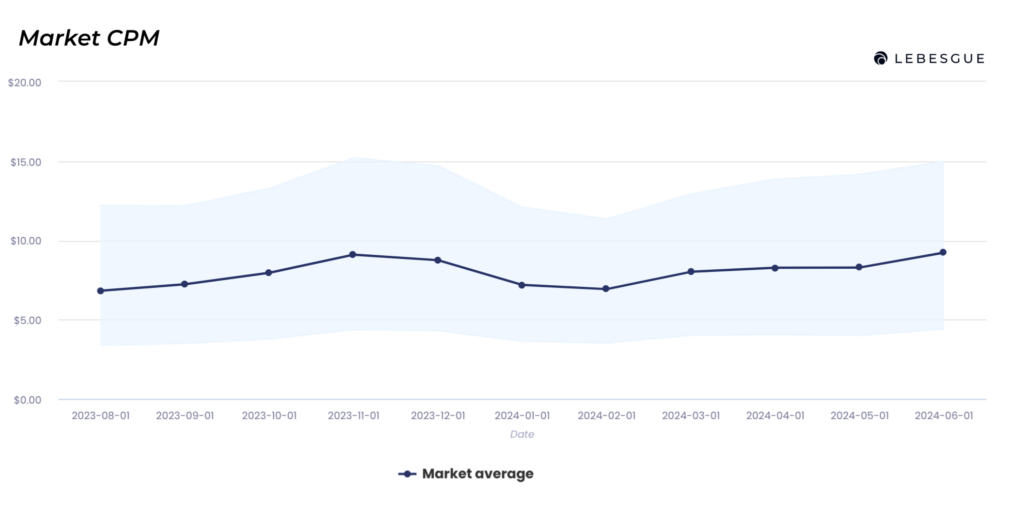
For example, during the holiday season more and more businesses start to run ads, and naturally, the CPM starts to increase due to a lot more competition.
On the other hand, January is generally one of the cheapest months to advertise since there is much less advertisers competing with you in the auction.
Looking at the graph below, you can clearly see how the average CPM in the market changes during Q4 and at the beginning of January, reaching its highest point in November and then plummeting mid-December.
CPM Benchmarks by Platform
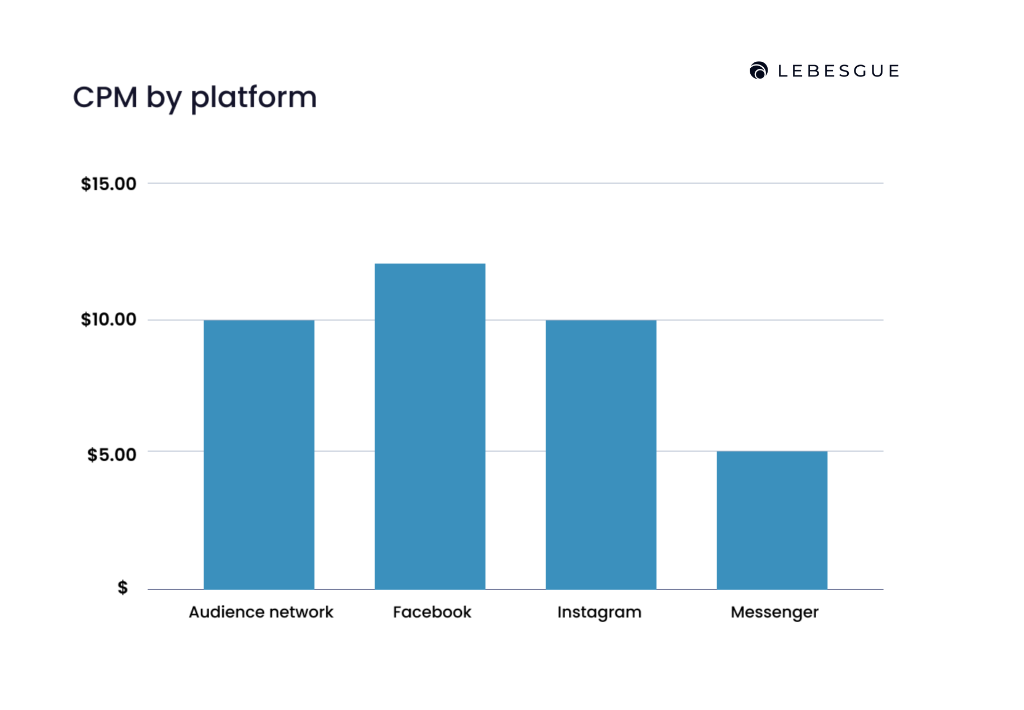
Among the platforms presented on the graph below, Facebook had the highest CPM throughout 2024, with 12.15 dollars, whereas Messenger had the lowest CPM with 3.64 dollars.
Now, you may not be surprised to see that Facebook had the highest average CPM out of these four platforms since the vast majority of advertisers wants to place their ads on Facebook.
But what about Facebook Ad placements? Should you put more budget to News, Feed or the Right Hand Column placement? Should you even manually choose your placements?
CPM Benchmarks by Placement
For those of you who are new to Facebook advertising and don’t know what placements are, essentially, they indicate the place where your ad can appear.
The platforms your ads can appear on are the ones that we mentioned above, so:
- Audience Network
- Messenger
Each of these platforms has multiple placement options, and each placement has different competition and ad cost (CPM). Therefore, the more competitive an ad placement is, the higher the CPM will be.
Based on our analysis, we’ve seen that the placements with the highest CPM are Rewarded Video, Facebook Stories, and News Feed.
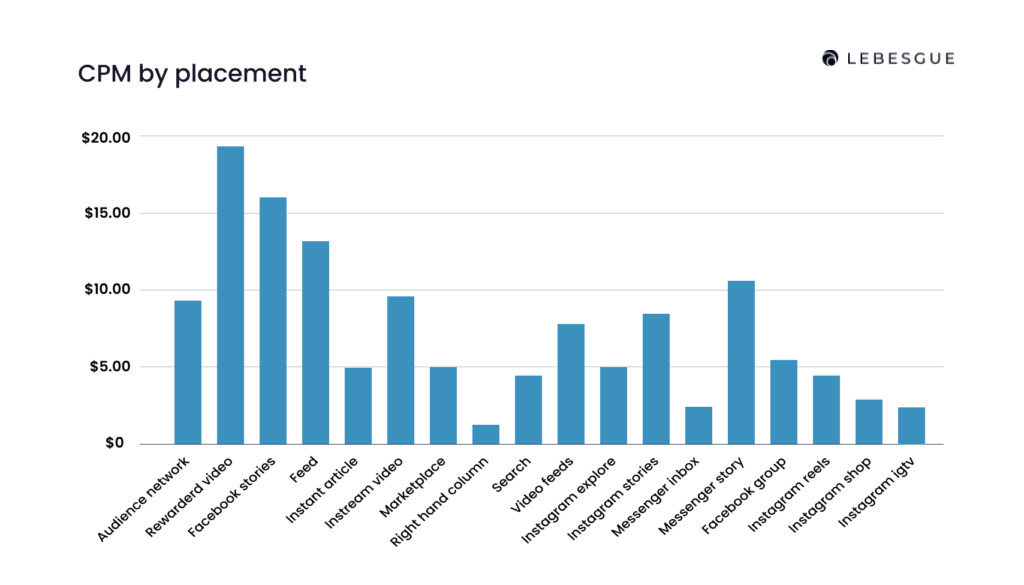
On the other hand, Right Hand Column, IGTV, and Messenger Inbox are on the “cheaper” side with an average CPM of $3. But does this mean that you should manually select only those placements?
Absolutely not, and here’s why.
First of all, when using manual placements, you’re putting a lot of restrictions on Facebook’s algorithm.
You may think that placements with a lower CPM will also have the best CR, but how can you really know where the majority of your potential customers is going to convert? You might just take a guess and then lose a lot more potential customers that would have converted on other available placements.
That’s just one of the many reasons why we recommend using automatic placements. The bottom line is that Facebook has a lot more data than you and can properly test out each placement and then optimize your ads to find people who are most likely to convert.
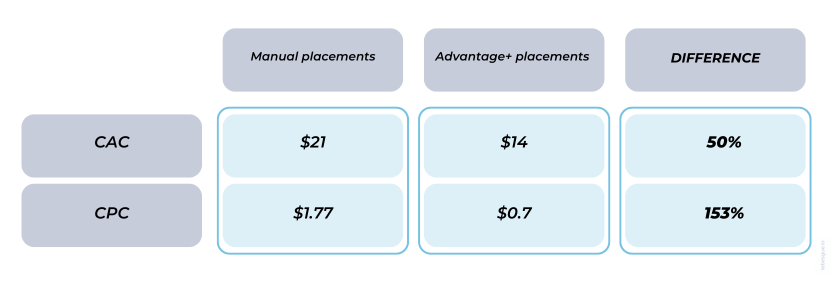
Psst… If you’re still skeptical, take a look at our a/b test results below.
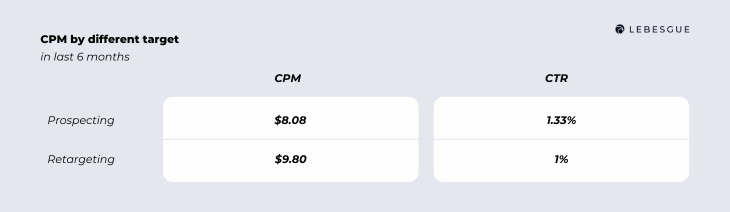
CPM Benchmarks by Audience Type
Next, we wanted to see how the CPM has changed during 2022 and 2023 based on the target audience.
On the graph below, you can clearly see what we mentioned before with CPM being affected by seasonality. If you take a closer look at the graph, you can see that those two spikes in 2022 and 2023 happened in the same period and are a result of an increase in the competition during the holiday season.
You can also see that the CPM is more than a 100% higher on retargeting campaigns than on prospecting (acquistion).
That comes as no surprise since the smaller your target audience is, the higher is the ad price (CPM) going to be.
And that’s simply because when targeting a smaller audience, you’re much more likely to enter ad fatigue, which makes your ads less effective.
Essentially, this means that the same people are seeing your ads over and over again, and therefore, not engaging with them which then leads Facebook to think your ads are not relevant to your audience – so your ad costs start to go up.
But that’s not all. We’ve taken this analysis one step further and decided to compare two audiences across four key metrics.
When testing this out, we’ve used the same creative, budget, landing page, optimization, etc. So everything remained the same – except for the audience.
As you can see from the results below, the CTR was almost the same, but the ROAS was much higher when using broad targeting.
Even though the CR was slightly higher on the 1% Lookalike audience, the CPM difference was much more bigger and significant. So when taking all of this into consideration, broad targeting was a clear winner.

CPM Benchmarks by Country
As we mentioned before, the CPM also depends on the country that you choose to advertise in.
Therefore, if you choose to target a country in which there’s a lot more competition, such as the US, you’ll most likely see a higher CPM than if you had chosen New Zealand as your target location.
And as you can see from the graph below, the US indeed is the most expensive country to advertise in.

Want More Benchmarks?
If you’d like to benchmark your Facebook or Google ads click-through rate, conversion rate, cost per mille or even your checkout funnel metrics to the market, check out our Lebesgue: AI CMO.