With the holiday season kicking off, it’s more important than ever to stay up-to-date with the latest Facebook benchmarks for 2025. In this blog post, we’ll be diving into the latest Facebook benchmarks by industry, giving you a detailed look at the performance metrics that are specific to your field.
From cost-per-mile (CPM) to conversion rate (CR), we’ll provide insights on how to improve your social media strategy and stay competitive on Facebook. Whether you’re in the beauty or food industry, this blog post will give you the information you need to optimize your Facebook presence in 2025.
Facebook Ads CTR Benchmarks by Industry
A high CTR indicates that a high percentage of people who see an ad are clicking on it, while a low CTR indicates the opposite.
A high CTR is generally considered to be a positive sign that an ad campaign is effective in reaching the right audience and resonating with them.
In contrast, a low CTR can be an indicator that the ad is not resonating with the target audience, or that the targeting is off.
According to our data, an average CTR of 0,88% is the lowest and it’s in the Food and Drink industry. On the other hand, the highest average CTR is in the Clothing and accessories industry and is 1.72%.
Here are the Facebook CTR breakdown by industry in 2025:
- Art and entertainment: 1.30%
- Clothing and accessories: 1.71%
- Food and drink: 0.88%
- Health and beauty: 0.98%
- Home and garden: 1.52%
- Sport and recreation: 1.18%
- Pet supplies: 0.99%
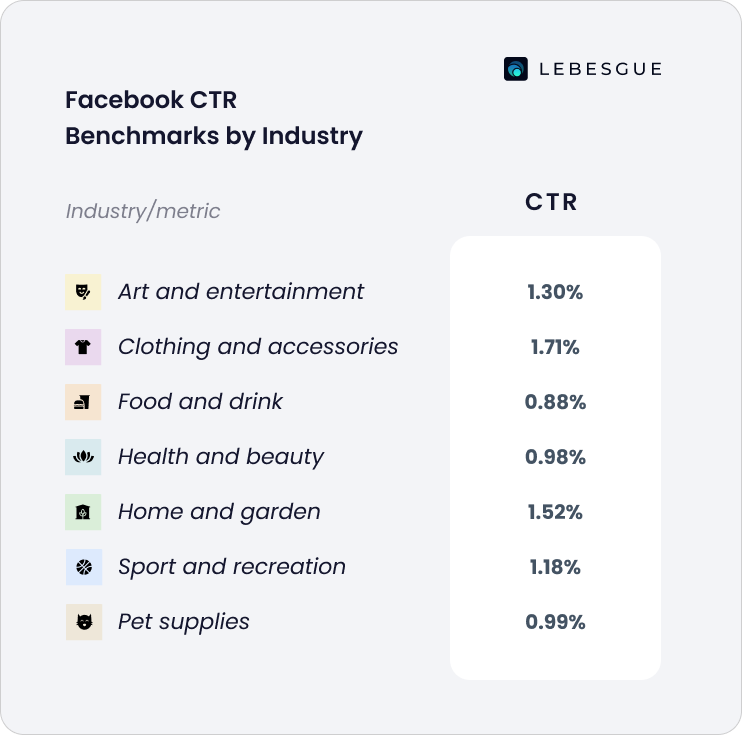
Home and garden are the second-highest CTR industry.
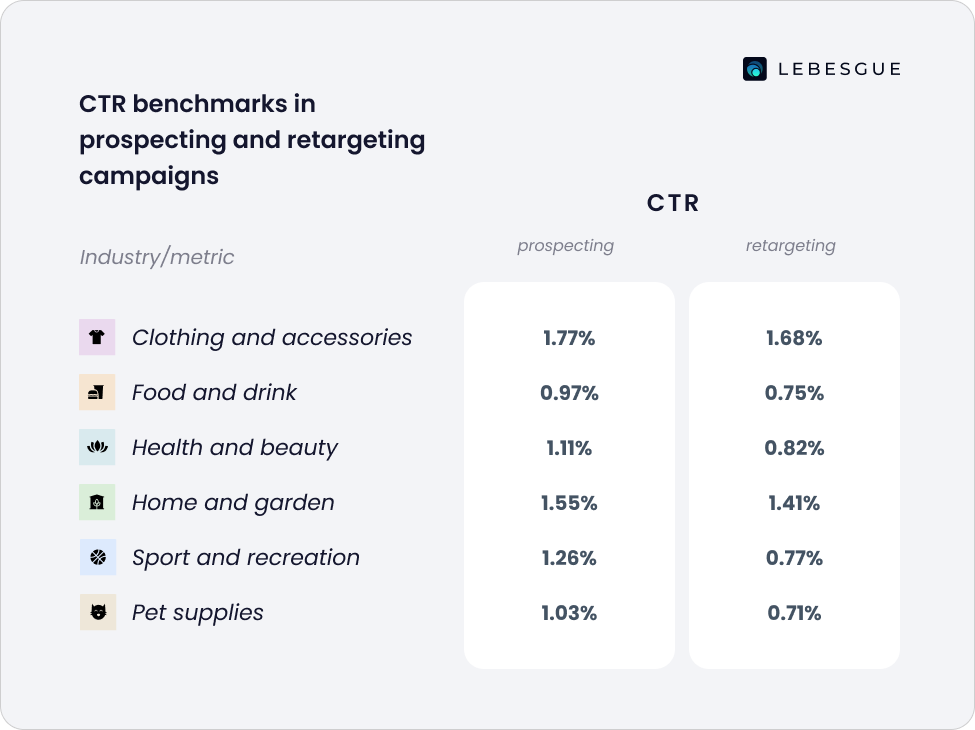
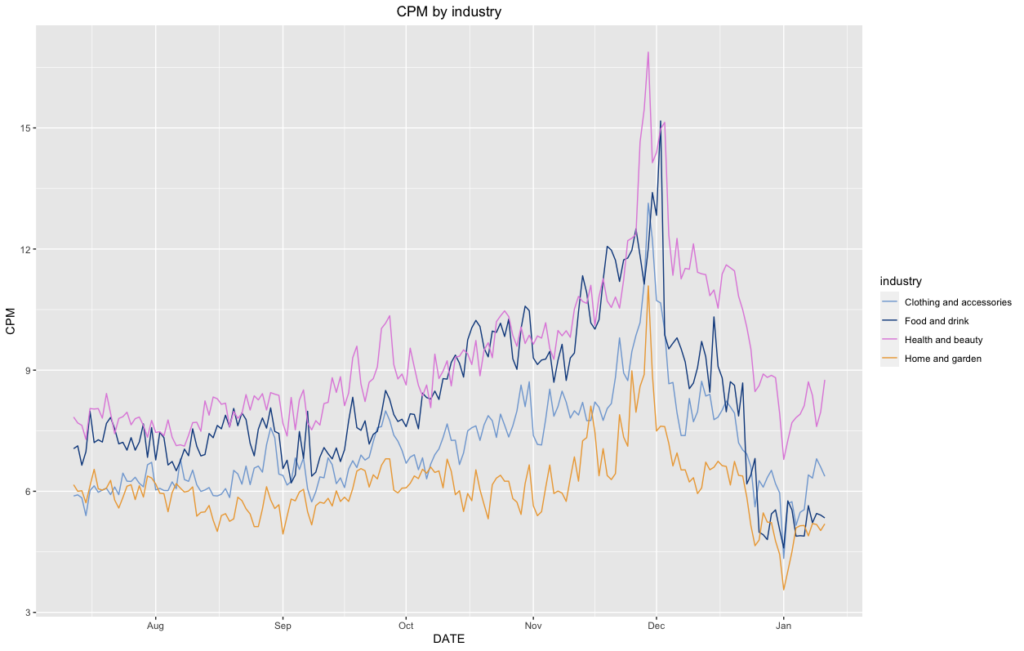
For this blog post, we compared the change in CTR between the two industries with the greatest difference in results. The graph below shows the difference in CTRs between Clothing and accessories and the Food and drinks industry.
CTR benchmarks in prospecting campaigns
But, what is the CTR like if we only look at prospecting campaigns?
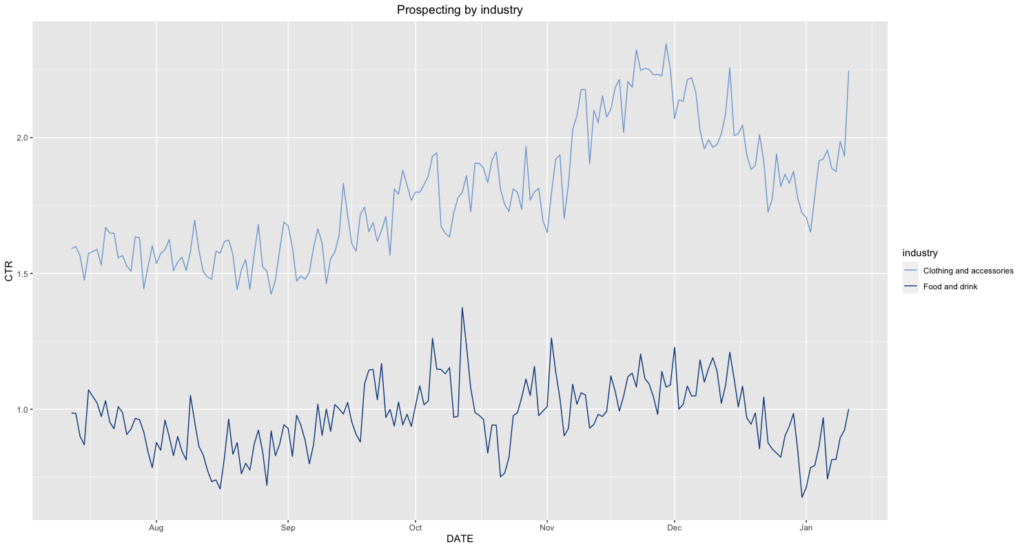
The highest CTR is still in the Clothing and Accessories industry, and it’s 1.77%, while the Food and Drink industry still has the lowest CTR of 0.97%. Health and Beauty and Home and Garden are industries with a CTR above 1%.
Here are the Facebook CTR breakdown by industry in prospecting campaigns:
- Clothing and accessories: 1.77%
- Food and drink: 0.97%
- Health and beauty: 1.11%
- Home and garden: 1.55%
- Sport and recreation: 1.26%
- Pet supplies: 1.03%
CTR benchmarks in retargeting campaigns
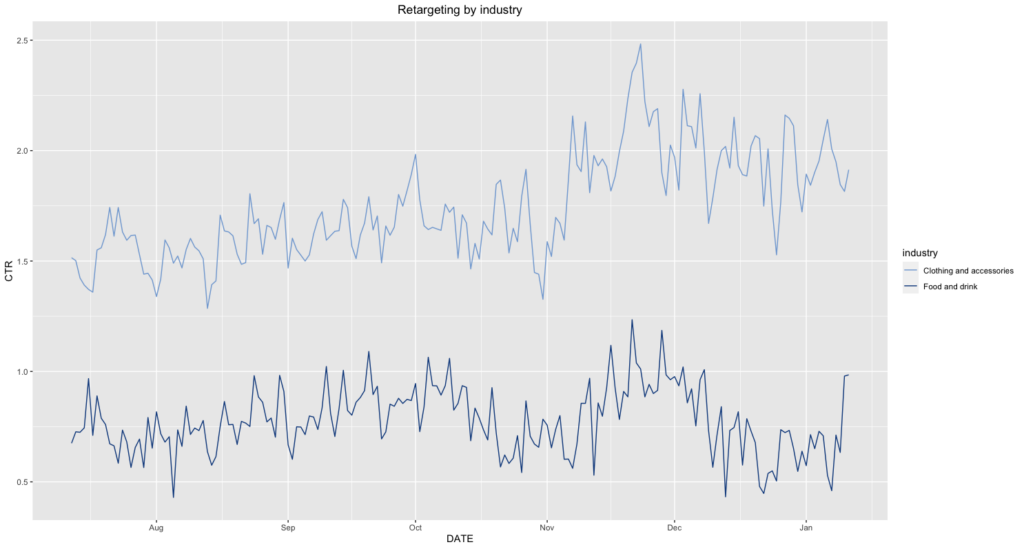
In retargeting campaigns, the industries with the highest CTR are Home and Garden and Clothing and Accessories.
All other industries have a CTR below 1%.
Here are the Facebook CTR breakdown by industry in retargeting campaigns:
- Clothing and accessories: 1.68%
- Food and drink: 0.75%
- Health and beauty: 0.82%
- Home and garden: 1.41%
- Sport and recreation: 0.77%
- Pet supplies: 0.71%
Facebook Ads CPM Benchmarks by Industry
A high CPM indicates that an ad campaign’s cost is relatively high in comparison to the number of impressions received, whereas a low CPM indicates the opposite.
A high CPM can be caused by a variety of factors, including poor targeting, low relevance, or high ad auction competition.
A low CPM, on the other hand, can be caused by effective targeting, high ad relevance, or low competition.
When we look at all CPMs across all industries, the CPM ranges from $5 to $11.
However, one industry that stands out from the rest is Per supplies. Pet supplies has the highest CPM of $10.90.
If we take into consideration the data of CTR, we can conclude that Food and Drink is the most expensive industry to run Facebook ads in, with the lowest CTR.
Here are the Facebook CPM breakdown by industry in 2025:
- Art and entertainment: $5.82
- Clothing and accessories: $7.45
- Food and drink: $7.91
- Health and beauty: $8.41
- Home and garden: $6.07
- Sport and recreation: $10.90
- Pet supplies: $5.69
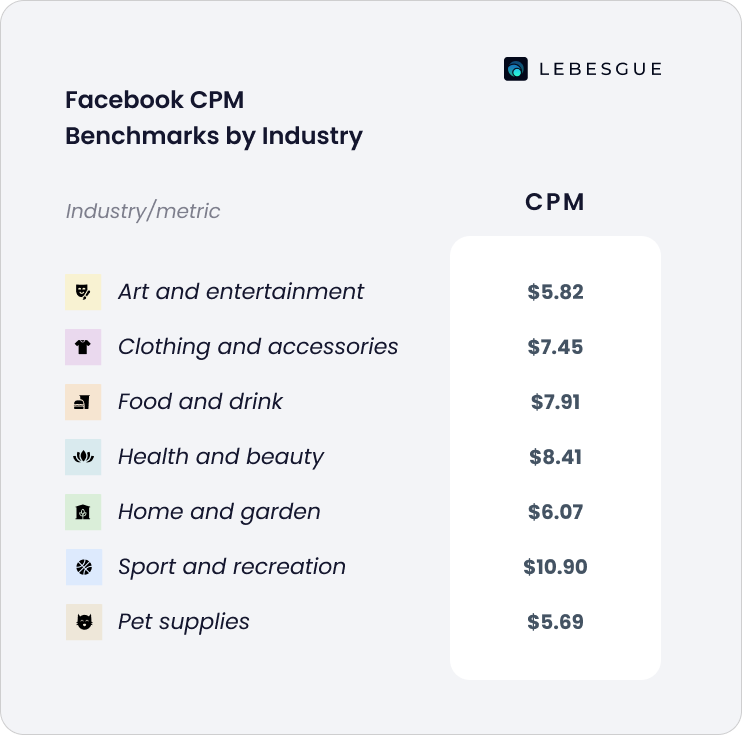
Art and entertainment is the most cost-effective industry for running Facebook ads. Facebook ads in the Arts and entertainment industry cost an average of $5.82.
CPM benchmarks in prospecting campaigns
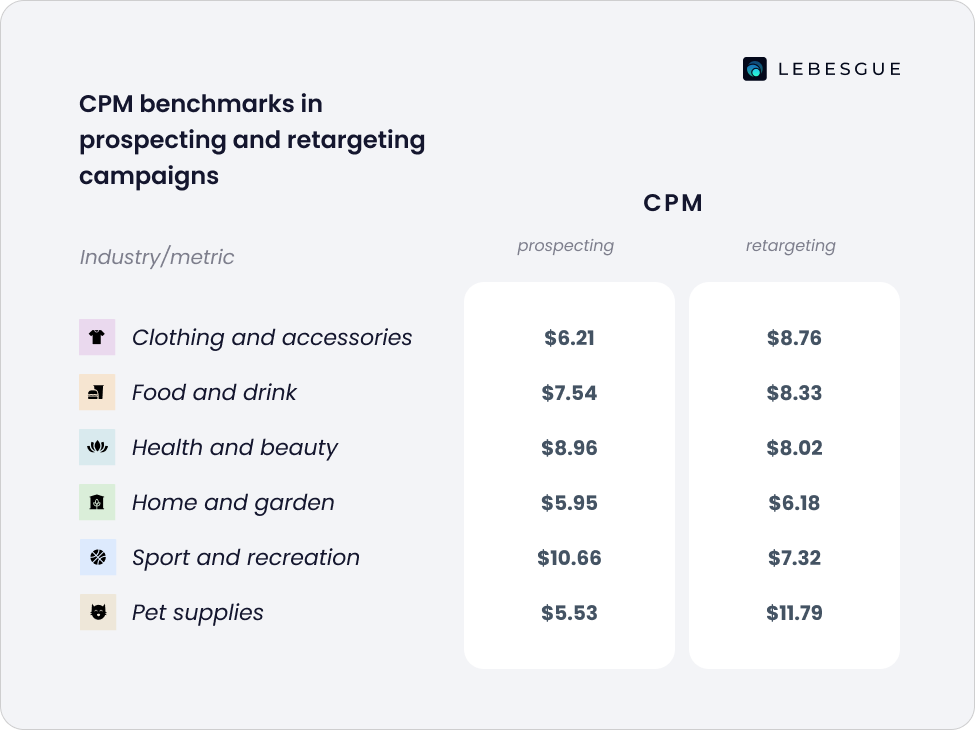
Regarding the CPM in prospecting campaigns the Food and Drinks industry has the highest CPM. The CPM in other industries is around $6, and in the Health and Beauty industry, it’s $8.00.
Here are the Facebook CPM breakdown by industry in prospecting campaigns for 2024:
- Clothing and accessories: $6.21
- Food and drink: $7.54
- Health and beauty: $8.96
- Home and garden: $5.95
- Sport and recreation: $10.66
- Pet supplies: $5.53
CPM benchmarks in retargeting campaigns
For retargeting campaigns, the lowest CPM is in the Home and garden industry and it’s around $6.18, in other industries the CPM is between $7 and $8.
Here are the Facebook CPM breakdown by industry in retargeting campaigns for 2025:
- Clothing and accessories: $8.76
- Food and drink: $8.33
- Health and beauty: $8.02
- Home and garden: $6.18
- Sport and recreation: $7.32
- Pet supplies: $11.79
Facebook Ads CR Benchmarks by Industry
When we analyzed CR data it appears that the Food and drink industry has the highest conversion rate.
The Sports and Recreation industry has the lowest conversion rate, while the Clothing and Accessories, and Food and Drink industries have relatively high CRs at 1.33% and 2.56% respectively.
Here are the Facebook CR breakdown by industry in 2025:
- Art and entertainment: 0.80%
- Clothing and accessories: 1.23%
- Food and drink: 3.26%
- Health and beauty: 2.48%
- Home and garden: 0.70%
- Sport and recreation: 0.71%
- Pet supplies: 2.72%
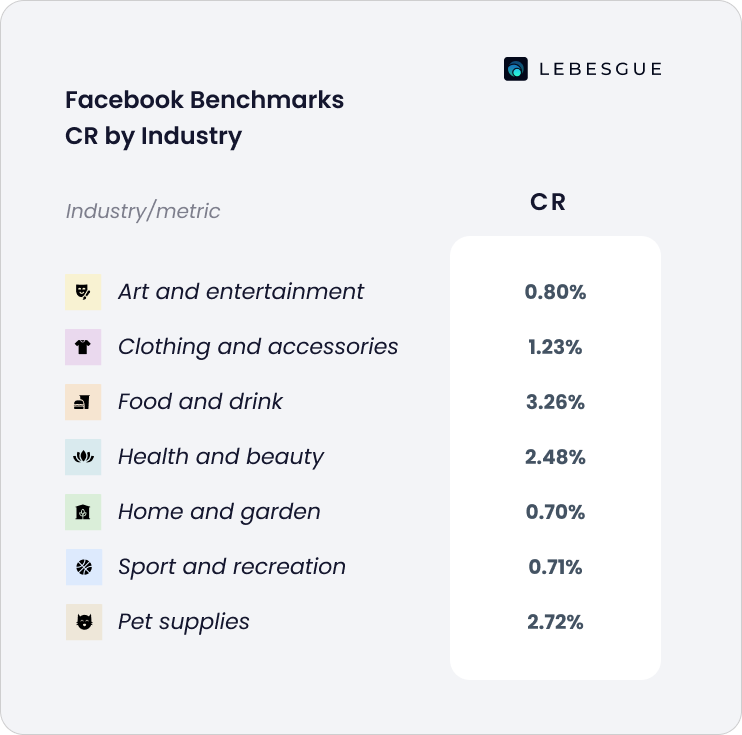
Also, these numbers indicate that the Health and Beauty industry performs well on Facebook in terms of conversion rate.
It could be that the Health and Beauty industry brands are using more effective ad targeting or creative strategies to drive conversions, or that their products and services simply have higher demand.
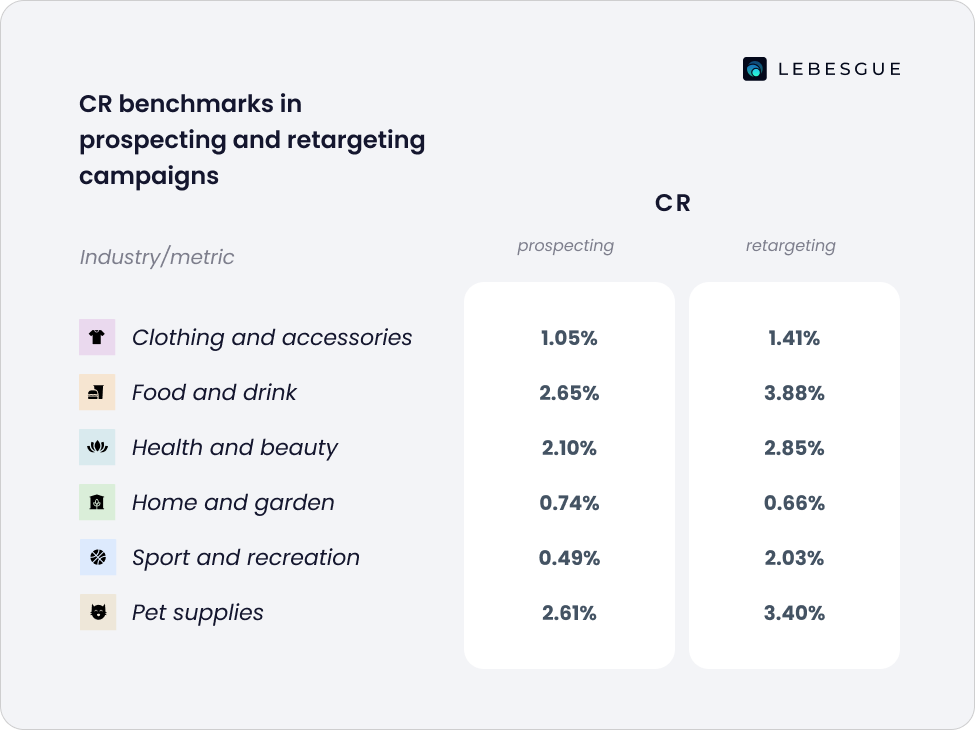
CR benchmarks in prospecting campaigns
The industries that have CR above 2% are Food and Drinks, Health and beauty, and Pet supplies.
Clothing and Accessories have a CR of around 1.05%, while the rest of the industries have a CR lower than 1%.
Here are the Facebook CR breakdown by industry in prospecting campaigns for 2025:
- Clothing and accessories: 1.05%
- Food and drink: 2.65%
- Health and beauty: 2.10%
- Home and garden: 0.74%
- Sport and recreation: 0.49%
- Pet supplies: 2.61%
CR benchmarks in retargeting campaigns
In retargeting campaigns, Food and Drink are the industry with the highest CR of 3.88%.
The lowest CR is found in the Home and Garden industry and it is 0.66%.
Here are the Facebook CR breakdown by industry in retargeting campaigns for 2025:
- Clothing and accessories: 1.41%
- Food and drink: 3.88%
- Health and beauty: 2.85%
- Home and garden: 0.66%
- Sport and recreation: 2.03%
- Pet supplies: 3.40%
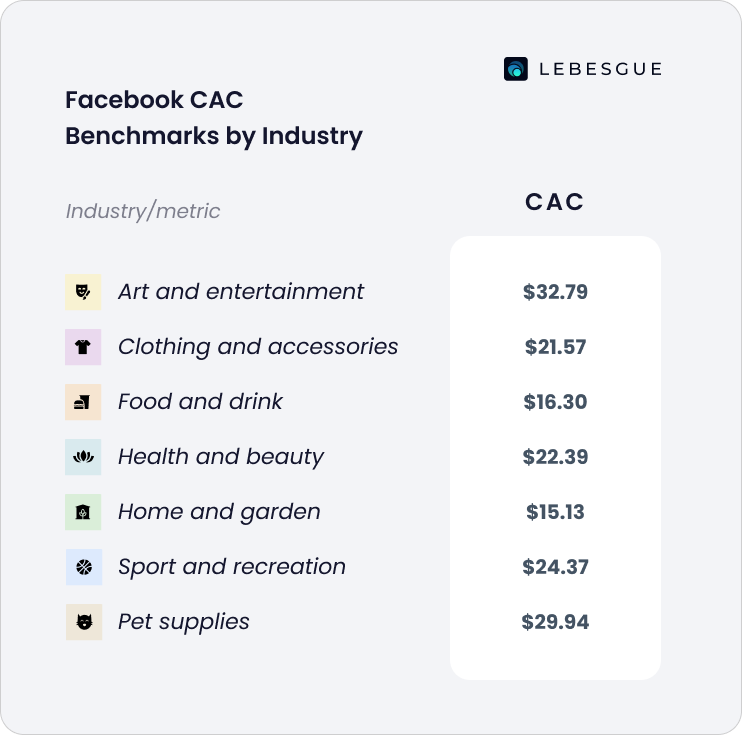
Facebook Ads CAC Benchmarks by Industry
Based on our data, the Art and entertainment industry has the highest CAC at $32.79, while the Home and garden has a lower CAC at $15.13.
The Clothing and accessories, Health and beauty, Sport and recreation industries have relatively similar CACs.
The Food and Drink has a CAC of $16.301 which is relatively low compared to the other industries.
Here are the Facebook CAC breakdown by industry in 2025:
- Art and entertainment: $32.79
- Clothing and accessories: $21.57
- Food and drink: $16.30
- Health and beauty: $22.39
- Home and garden: $15.13
- Sport and recreation: $24.37
- Pet supplies: $29.94
It’s important to note that the CAC should be evaluated alongside the lifetime value of a customer (LTV) to understand the overall profitability of acquiring a customer.
If you have trouble calculating your Facebook ads LTV you can use Lebesegue: AI CMO.
Our feature LTV by Marketing Channel enables you to objectively analyze every marketing channel, do a deep dive into their long-term performance, and easily decide on the budget split of your campaigns.
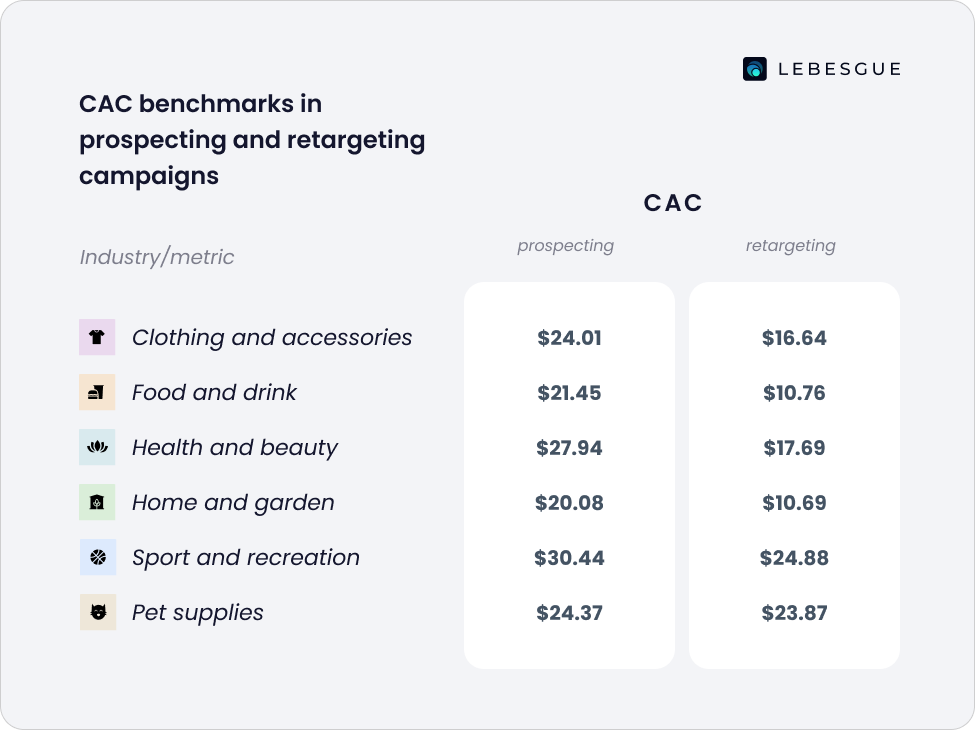
CAC benchmarks in prospecting campaigns
The industry that is most expensive to acquire a new customer is Sport and recreation and the cheapest is Home and Garden.
Here are the Facebook CAC breakdown by industry in prospecting campaigns for 2025:
- Clothing and accessories: $24.01
- Food and drink: $21.45
- Health and beauty: $27.94
- Home and garden: $20.08
- Sport and recreation: $30.44
- Pet supplies: $24.37
CAC benchmarks in retargeting campaigns
The Health and Beauty industry has one of the lowest CAC in retargeting campaigns. Along with the Health and Beauty industry, Clothing and Accessories have a relatively low CAC compared to other industries.
Here are the Facebook CAC breakdown by industry in retargeting campaigns for 2025:
- Clothing and accessories: $16.64
- Food and drink: $10.76
- Health and beauty: $17.69
- Home and garden: $10.69
- Sport and recreation: $24.88
- Pet supplies: $23.87
Summing Up
To sum up, the provided data shows that different industries have different performance levels on Facebook in terms of conversion rate, click-through rate, CPM, and CAC.
It’s worth noting that these numbers are just a snapshot of Facebook benchmarks by industry and that it’s important to consider other factors such as ad spend, audience size, conversion rates, click-through rates, and other metrics before drawing conclusions.
It’s also important to consider the specific business objectives and use the data accordingly. Additionally, CAC should be evaluated along with the lifetime value of a customer(LTV) to understand the overall profitability of acquiring a customer.


