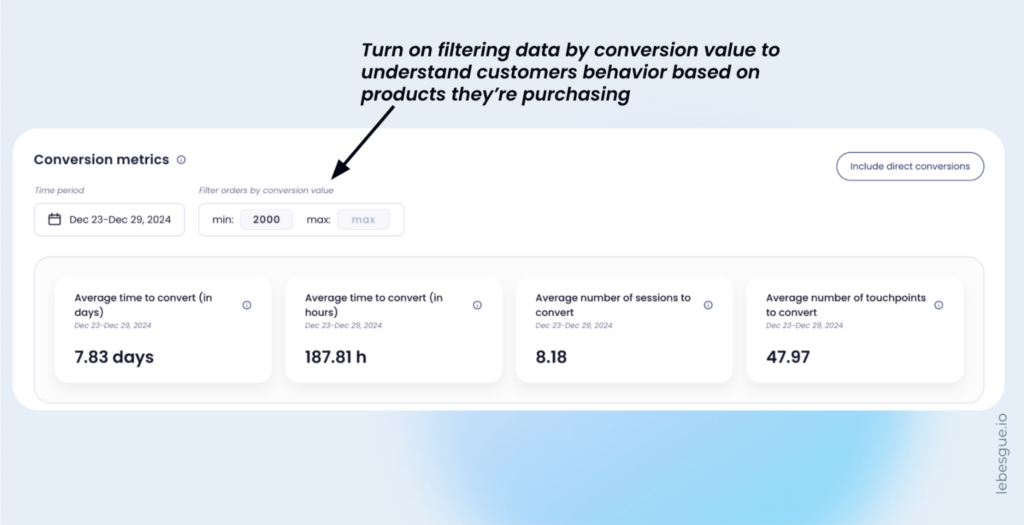
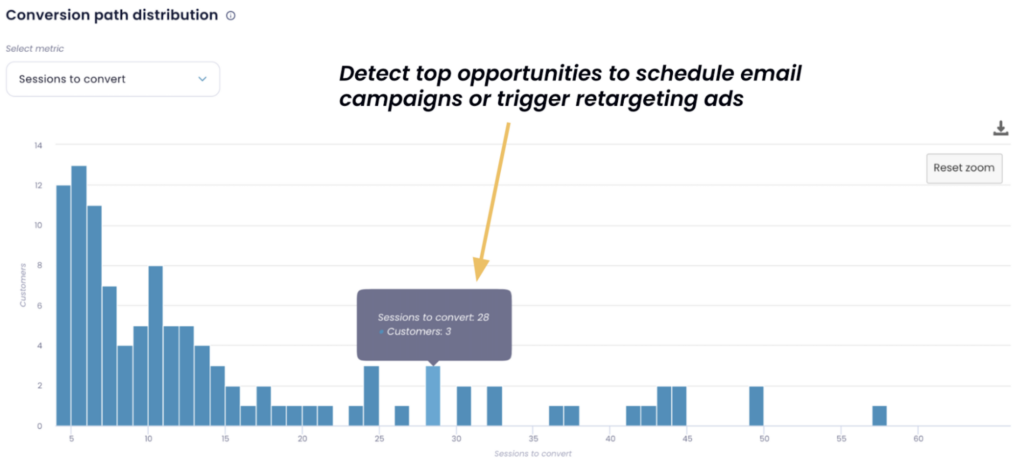
In e-commerce, understanding customer behavior is essential. Key metrics like average time to convert, sessions per conversion, touchpoints per conversion, and conversion value filtering provide valuable insights into user journeys. These insights help optimize campaigns, improve user experience, and increase ROI.
Traditional analytics tools like Google Analytics (UA & GA4) often don’t offer the full picture. In this blog, we’ll show how Le-Pixel, our advanced tracking solution, addresses these gaps and delivers clearer, more actionable data.
Key E-commerce Metrics Explained
Key e-commerce metrics are the core measures of e-commerce performance. The key metrics that are typically used to evaluate an e-commerce store’s success are:
- Average time to convert
- Average number of sessions per conversion
- The average number of touchpoints per conversion, and
- Filtering by conversion value
These metrics are essential for analyzing the customer journey and understanding how shoppers interact with your store before making a purchase.
They provide valuable insights into user behavior, helping to identify key touchpoints and timeframes that influence conversion, enabling you to optimize your sales funnel effectively.
Let’s explore each one of the metrics and see how you can get this insights for your Shopify store.
Average time to convert (days/hours)
First, let’s start with the average time to convert.
Average time to convert measures the time between a customer’s first interaction with your store and their final purchase.
So, with this metric, you can understand how long it typically takes for your customers to make a purchase decision.
Refining strategies like retargeting ads, follow-up emails, and promotional timing rely on understanding conversion patterns.
For instance, if most conversions occur within 48 hours, you can adjust campaigns to maximize their impact during this critical window.
Le Pixel excels in providing these insights by accurately tracking and combining time data across sessions and devices, offering more precise and actionable information compared to GA4.


Average number of session per conversion
Next, the average number of sessions per conversion.
The average number of visits before purchase refers to the average number of times a customer visits your store before completing a purchase.
These metrics reveal how many interactions are typically needed for a customer to make a decision.
Understanding the average number of sessions per conversion can help you plan retargeting strategies, such as sending abandoned cart emails after a specific number of sessions.
For example, if it usually takes 3 visits, you can create marketing automation workflows to encourage customers between each session.
Le-Pixel excels in this area by tracking sessions across devices seamlessly, avoiding the data fragmentation that can occur with GA4.

Average number of touchpoints per conversion
The number of interactions before conversion measures how many actions (clicks, views, or other engagements) a customer performs before making a purchase.
With the average number of touchpoints per conversion, you can identify how many interactions are required for customers to convert and highlight any friction points in the customer journey.
Understanding this part of the customer journey can improve customer experience, such as simplifying navigation or offering clearer calls to action.
Le-Pixel excels by tracking every on-site interaction with server-side accuracy, ensuring precise data without the risk of tracking gaps.
Filtering by conversion value
Lastly, filtering bu conversion value.
Filtering by conversion value means segmenting conversion data by product value.
Segmenting conversion data by product value involves breaking down conversion data based on the value of the product purchased. This helps prevent misleading insights that could be caused by low-value purchases.
For example, a furniture store could filter conversions over $1,000 and find that these higher-value items require more sessions and touchpoints before purchase.
This insight allows for more targeted retargeting strategies on platforms like Facebook, Instagram, and Google Ads, as well as more precise email marketing automation based on different product views and abandoned cart products.
Le Pixel excels in this area by offering customizable filters, enabling precise analysis of conversion data for more effective decision-making.
Maximixing Business Value with Key Metrics
By tracking metrics like average time to convert, sessions per conversion, touchpoints per conversion, and filtering by conversion value, you can drive meaningful improvements in key areas of your marketing efforts.
These insights help you optimize retargeting by fine-tuning ad spend and focusing on the most impactful stages of the customer journey.
You’ll see the most value of these key metrics in:
- Better reporting: Precise data allows you to optimize ad spend and prioritize the most critical stages of the journey.
- Improved funnel optimization: Identify where customers drop off and address weak points in your conversion funnel.
- Personalization: Adapt your communication frequency and content based on user behavior patterns to engage them more effectively.
- Performance benchmarking: Set realistic KPIs for your ad campaigns and email sequences to track and measure your success.
With these metrics, you can make data-driven decisions that improve customer experience and maximize ROI across all your marketing channels.
If you noticed that most conversions occur after five touchpoints, you can tailor your ad campaigns, emails, and on-site CTAs to guide customers smoothly through each stage of the process.
On the other hand, if your time to convert is unusually long, it may be a sign that stronger urgency triggers are needed. To encourage faster decision-making and drive quicker conversion you can use “Limited-Time Offer” banners.
How to Use Web Metrics to Optimize Your Shopify Store
Let’s say FitCore is an online store that sells premium home fitness equipment like smart dumbbells, resistance bands, and fitness trackers. Their primary traffic comes from paid ads (Meta & Google), and they notice their ad spend isn’t delivering the expected ROAS.
Let’s explore how FitCore can analyze data effectively using Le-Pixel and GA4 to gain deeper insights into your store’s performance.
Analyze data with Le-Pixel
Average Time to Convert: 4 days
Insigh
Most customers don’t buy fitness equipment impulsively. They research and compare products before committing.
Action
FitCore decides to set up automated follow-up emails across 4 days, offering product comparisons, customer testimonials, and a 10% discount on the 4th day to seal the deal.
Average Number of Sessions to Convert: 3 sessions
Insigh
Customers typically visit the site three separate times before making a purchase.
Action
FitCore runs retargeting ads after the first session with messages like, “Still thinking about your perfect home gym setup? Here’s why FitVibe is the right choice!”
After the second session, they use urgency-based messaging like, “Your smart dumbbells are almost out of stock. Order now to secure yours!”
Average Number of Touchpoints to Convert: 12 touchpoints
Insigh
The journey involves multiple interactions—clicking on product pages, reading reviews, visiting the FAQ page, and even revisiting the homepage.
Action
FitCore optimizes the customer journey:
- Makes sure product pages have comprehensive FAQs.
- Ensures reviews are highlighted prominently.
- Simplifies the checkout process.
They also trigger a chatbot after the 8th touchpoint: “Need help choosing the right equipment? Chat with our fitness expert now!”
By analyzing the data with Le-Pixel, FitCore can make strategic improvements to its operations.
They optimize ad spend by focusing budgets on retargeting campaigns tailored for the 4-day conversion window, improving efficiency.
Personalized follow-ups and messaging help reduce customer hesitation, boosting conversion rates.
Additionally, FitCore enhances the user experience by eliminating friction points in the browsing journey, resulting in smoother navigation and fewer drop-offs.
As a result, FitCore achieves a higher ROAS through better timing and targeting of ads, lowers cart abandonment rates with strategic nudges, and increases customer satisfaction through a more seamless journey, improved communication, and timely support.
Can GA4 track metrics like time to convert, sessions per conversion, and touchpoints?
Short Answer: Yes, Google Analytics 4 (GA4) can track time to convert, sessions per conversion, and touchpoints, but with significant limitations and technical overhead.
Let’s break it down:
Average Time to Convert (Days/Hours)
GA4 Capability
GA4 can track “Time to Conversion” through the Advertising > Attribution > Conversion Paths report.
Limitations
The report shows time lags but doesn’t offer deep granularity (e.g., average time in hours).
Cross-device tracking relies on Google Signals (if enabled), but accuracy suffers if users don’t consent to ad personalization.
Privacy restrictions (like Apple’s iOS updates) can limit data collection.
Le-Pixel advantage
More reliable data via server-side tracking, better cross-device consistency, and granularity down to hours.
Average Number of Sessions to Convert
GA4 Capability
GA4 shows the number of touchpoints per conversion in the Conversion Paths report.
Limitations
GA4 groups data into general buckets (e.g., 1-3, 4-8 sessions).
Granular data (e.g., precise average session count per conversion) isn’t available without heavy querying in BigQuery.
Session stitching can still break if users clear cookies or switch devices.
Le-Pixel advantage
Precise session counts across sessions and devices without reliance on GA4’s sampling or aggregation.
Average Number of Touchpoints to Convert
GA4 Capability
GA4 does track touchpoints in the Conversion Paths report.
Limitations
GA4 primarily tracks marketing touchpoints (e.g., ad clicks, email opens) rather than on-site touchpoints (e.g., button clicks, specific modal interactions).
Custom event tagging in GA4 is time-consuming and complex.
Many on-site interactions aren’t captured without a custom setup.
Le-Pixel advantage
Le Pixel provides a more reliable, detailed, and actionable analysis of touchpoints, helping you refine your customer journey strategies and boost conversions.
Summing Up
Le Pixel provides a reliable and comprehensive way to track key e-commerce metrics, addressing the limitations of tools like GA4. With server-side tracking and advanced filtering, Le Pixel delivers accurate data, seamless cross-device tracking, and actionable insights that help optimize your marketing strategies and improve ROI.
Ready to take your e-commerce analytics to the next level? Request a demo of Le Pixel today and see the impact of first-party data for yourself!
Frequently Asked Questions about Le-Pixel vs. Google Analytics 4
Le-Pixel combines client-side and server-side tracking to ensure comprehensive and reliable data collection. GA4, on the other hand, primarily relies on client-side tracking with an enhanced event-based data model.
Le-Pixel accurately tracks conversion timelines across sessions and devices, providing precise data down to the hour. GA4 tracks “Time to Conversion,” but its accuracy depends on Google Signals and user consent, which can limit granularity.
Yes, Le-Pixel captures exact session counts across devices without fragmentation, offering highly accurate insights into user interactions. GA4 groups session counts into general buckets (e.g., 1-3, 4-8) and often requires heavy querying for deeper analysis.
Le-Pixel tracks all on-site interactions, including micro-interactions like button clicks and scroll depth, using server-side accuracy. GA4 focuses more on marketing touchpoints (e.g., ad clicks, email opens) and requires custom event tagging for detailed tracking.
Yes, Le Pixel requires minimal customization and seamlessly integrates client-side and server-side data, reducing technical overhead. In contrast, GA4 often needs complex setups and BigQuery integration for detailed analysis.
Le-Pixel provides high data accuracy through its server-side tracking, minimizing data loss from ad blockers and cookie restrictions. GA4’s accuracy can be affected by user consent and its reliance on cookies, leading to potential data gaps.
Le-Pixel aligns smoothly with data privacy laws like GDPR and CCPA, ensuring secure and compliant data handling. GA4 also complies with these regulations but depends on proper setup and user consent to navigate evolving privacy laws.
Le-Pixel offers advanced customizable filters, allowing segmentation based on criteria like conversion value. GA4 has limited customization unless a significant event setup is performed.
Yes, Le-Pixel offers real-time tracking by integrating both client-side and server-side data. GA4 also supports real-time reporting but may miss some on-site interactions without custom event tagging.
Le-Pixel’s server-side tracking minimizes the impact of ad blockers, ensuring consistent and complete data collection. GA4’s client-side tracking is more vulnerable to ad blockers, potentially leading to incomplete data.


