Attribution is key to understanding how your marketing efforts contribute to sales and customer actions, especially in e-commerce where customers interact with multiple touchpoints before making a purchase. Given the importance of attribution in optimizing your marketing efforts, this blog post provides a comprehensive overview of various attribution models.
We’ll explore popular methods like:
- First Click,
- Last Click,
- Time Decay,
- U-Shaped (Position-Based),
- LE-Attribution (our custom-built model),
- Shapley Value, and
- Markov Chain Modeling.
For each model, we’ll discuss its strengths, weaknesses, and practical applications in e-commerce, enabling you to make informed, data-driven decisions that maximize your marketing ROI.
So, without further ado, let’s explore the various available attribution models.
Attribution Modeling Methods
Attribution Modeling Methods are frameworks used to assess and assign credit to various marketing channels for their role in driving conversions.
These methods help businesses understand the effectiveness of their marketing efforts by analyzing customer interactions across multiple touchpoints throughout the buyer’s journey.
By employing different attribution models, companies can gain valuable insights into which channels contribute most to sales, enabling them to allocate resources more effectively and optimize marketing strategies.
- First Click Attribution
- Last Click Attribution
- Time Decay Attribution
- U-Shaped (Position-Based) Attribution
- Le-Attribution
- Shapley Value Attribution
- Markov Chain Modeling
These attribution models offer various perspectives on marketing effectiveness, helping businesses make informed decisions about their strategies and investments.
Each model has its strengths and weaknesses, making it important to choose one that aligns with specific business goals and customer behaviors.
First Click Attribution
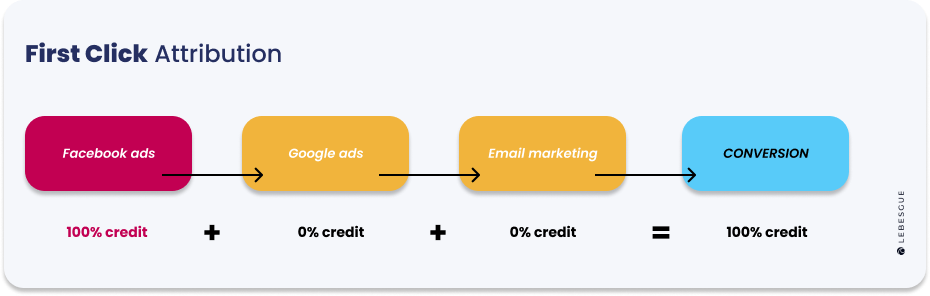
First Click Attribution is a marketing attribution model that assigns 100% of the credit for a conversion to the first interaction a customer has with your brand.
This model emphasizes the importance of the initial touchpoint, helping marketers understand which channels or campaigns effectively generate awareness and drive potential customers to engage with their brand.
While it’s straightforward, it may overlook the contributions of subsequent interactions that nurture the customer toward conversion.
Pros and cons First Click Attribution
Before choosing First Click Attribution as your model, it’s essential to understand its pros and cons.
Pros:
- Simplicity: This model is straightforward to implement and easy to understand, making it accessible for marketers at any level.
- Highlights Awareness Channels: It effectively emphasizes channels that first introduce customers to your brand, helping to identify key awareness drivers.
- Clear Attribution: First Click Attribution provides a clear starting point for mapping customer journeys, allowing for easier analysis of initial touchpoints.
Cons:
- Ignores Subsequent Interactions: One major drawback is that it overlooks the touchpoints that nurture leads and ultimately close sales, which can lead to an incomplete picture.
- Oversimplification: The model may oversimplify the customer journey, not reflecting the true impact of all marketing activities on conversion.
- Potential Misallocation: There’s a risk of overinvesting in channels that generate initial interest but don’t contribute to final conversions, which can skew marketing budgets.
First Click Attribution assigns all credit for a conversion to the first marketing channel a customer interacts with. This model is valued for its simplicity and its ability to highlight the effectiveness of awareness channels in introducing customers to your brand.
However, it has significant limitations, including the failure to consider subsequent touchpoints that nurture or close sales, which can lead to an oversimplified view of the customer journey and potential misallocation of marketing resources.
Last Click Attribution
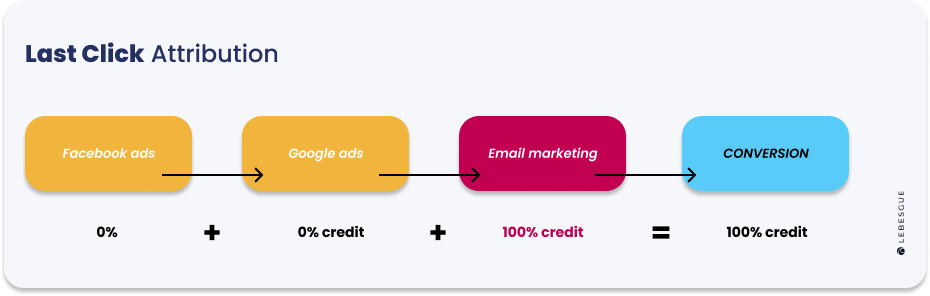
Last Click Attribution is a marketing attribution model that assigns all credit for a conversion to the final marketing channel or touchpoint that a customer interacts with before completing a purchase.
This model focuses on identifying which last interaction drove the sale, helping marketers understand the effectiveness of their closing channels. It is widely used due to its straightforwardness and the ease of tracking the last point of contact in the customer journey.
However, it overlooks earlier touchpoints that may have played a crucial role in nurturing the lead and guiding the customer toward the final decision.
Pros and cons Last Click Attribution
Before opting for Last Click Attribution as your model, it’s important to consider its pros and cons.
Pros:
- Simplicity: This model is straightforward to implement and easy to understand, making it accessible for marketers of all experience levels.
- Focus on Conversion Points: It effectively highlights the channels that close sales, allowing for targeted analysis of conversion strategies.
- Widely Adopted: Last Click Attribution is commonly used as a default in many analytics platforms, making it familiar and easy to integrate into existing reporting frameworks.
Cons:
- Ignores Earlier Touchpoints: One major drawback is that it overlooks earlier interactions that may have contributed to nurturing the lead and guiding the customer toward conversion.
- Potential Bias: It may overvalue channels that customers naturally use to finalize purchases, such as direct traffic, which could skew results.
- Oversimplification: The model can provide an incomplete view of the customer journey by focusing solely on the last interaction, potentially missing out on the true impact of all marketing efforts.
So with Last Click Attribution, all credit for conversions will be assigned to the final marketing channel a customer interacts with before making a purchase.
This model is popular for its simplicity and its ability to identify which channels effectively drive immediate sales.
However, it has significant limitations, as it ignores earlier touchpoints that contribute to the customer journey and may lead to an incomplete understanding of marketing effectiveness. Marketers should consider these factors when deciding whether to use Last Click Attribution in their strategy.
Time Decay Attribution
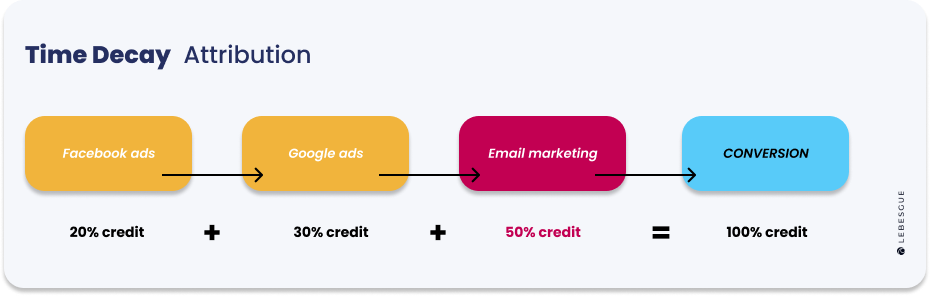
Time Decay Attribution is a model that gives more credit to marketing touchpoints that occur closer in time to the conversion event.
The idea is that the interactions happening just before a sale have a stronger influence on the customer’s decision, while earlier interactions still receive some credit but less so as they get farther from the conversion.
This model uses an exponential decay formula, meaning the value of each touchpoint decreases the further away it is from the final conversion. It’s useful for businesses with longer sales cycles, where timing plays a crucial role in a customer’s decision-making process.
Time Decay Attribution recognizes that recent interactions are often more influential in driving conversions, while still acknowledging the contribution of earlier touchpoints.
Pros and cons Time Decay Attribution
Before choosing Time Decay Attribution for your marketing strategy, weighing its pros and cons is important.
Pros:
- Accounts for Recency: This model emphasizes recent interactions, reflecting the assumption that closer touchpoints to conversion have a stronger influence.
- Balanced Credit: While it gives more credit to recent touchpoints, it still allocates some credit to earlier interactions, making it more balanced than single-touch models.
- More Realistic: It better reflects customer behavior by recognizing that multiple touchpoints play a role in driving conversions, with recent ones being more impactful.
Cons:
- Arbitrary Decay Rate: The rate at which credit decays over time may not always accurately reflect real customer behavior, making it somewhat subjective.
- Increased Complexity: This model is more complex than simple attribution models, requiring more sophisticated data handling and analysis.
- Potential Undervaluation: It may undervalue early-stage touchpoints, like awareness channels, which are crucial for bringing in new leads but may not lead to an immediate conversion.
To sum up, Time Decay Attribution assigns more credit to marketing touchpoints that happen closer to the conversion, while earlier interactions still receive some recognition.
It’s useful for reflecting the increased influence of recent interactions, making it a balanced approach for businesses with longer sales cycles.
However, it can be more complex to implement and may undervalue earlier touchpoints that play a critical role in awareness.
U-Shaped (Position-Based) Attribution
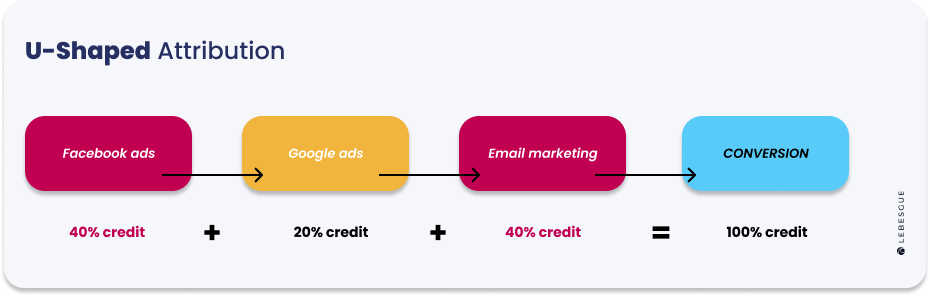
U-Shaped Attribution, also known as Position-Based Attribution, is a model that gives the most credit to the first and last touchpoints in the customer journey.
It recognizes the importance of both the initial interaction, which introduces the customer to the brand, and the final interaction, which closes the sale. The remaining credit is distributed equally among any middle interactions, though these typically receive less weight.
This model aligns with the idea that awareness and conversion are crucial, making it ideal for businesses that focus on building brand awareness and driving conversions. It offers a more balanced approach by recognizing multiple stages in the customer journey.
Pros and cons for U-Shaped Attribution
Before adopting a U-Shaped Attribution, it’s important to consider its advantages and limitations.
Pros:
- Balanced Approach: It gives significant credit to both the first and last touchpoints, reflecting the importance of both awareness and conversion.
- Customizable: The distribution of credit can be adjusted based on specific business needs, offering flexibility in how touchpoints are valued.
- Aligns with the Marketing Funnel: This model mirrors the typical marketing funnel, acknowledging the need to nurture leads from awareness to conversion.
Cons:
- Subjective Credit Allocation: The division of credit between touchpoints can feel arbitrary, and may not always reflect the true influence of each channel.
- More Complex: It requires tracking and analyzing multiple touchpoints, which can make implementation more challenging compared to simpler models.
- Undervalues Middle Interactions: Middle touchpoints may receive minimal credit, even if they play a key role in nurturing leads toward conversion.
U-Shaped Attribution gives the most credit to the first and last touchpoints in a customer journey, emphasizing the importance of both awareness and conversion.
It assigns less credit to middle interactions, offering a balanced view of the marketing funnel. While flexible and aligned with multi-stage campaigns, it can undervalue the role of nurturing channels and requires more complex tracking.
In e-commerce, this model is useful for customer journey mapping, helping businesses understand how different touchpoints contribute to overall sales. It also supports cross-channel marketing, allowing brands to evaluate the combined effect of email campaigns, social media, and paid ads.
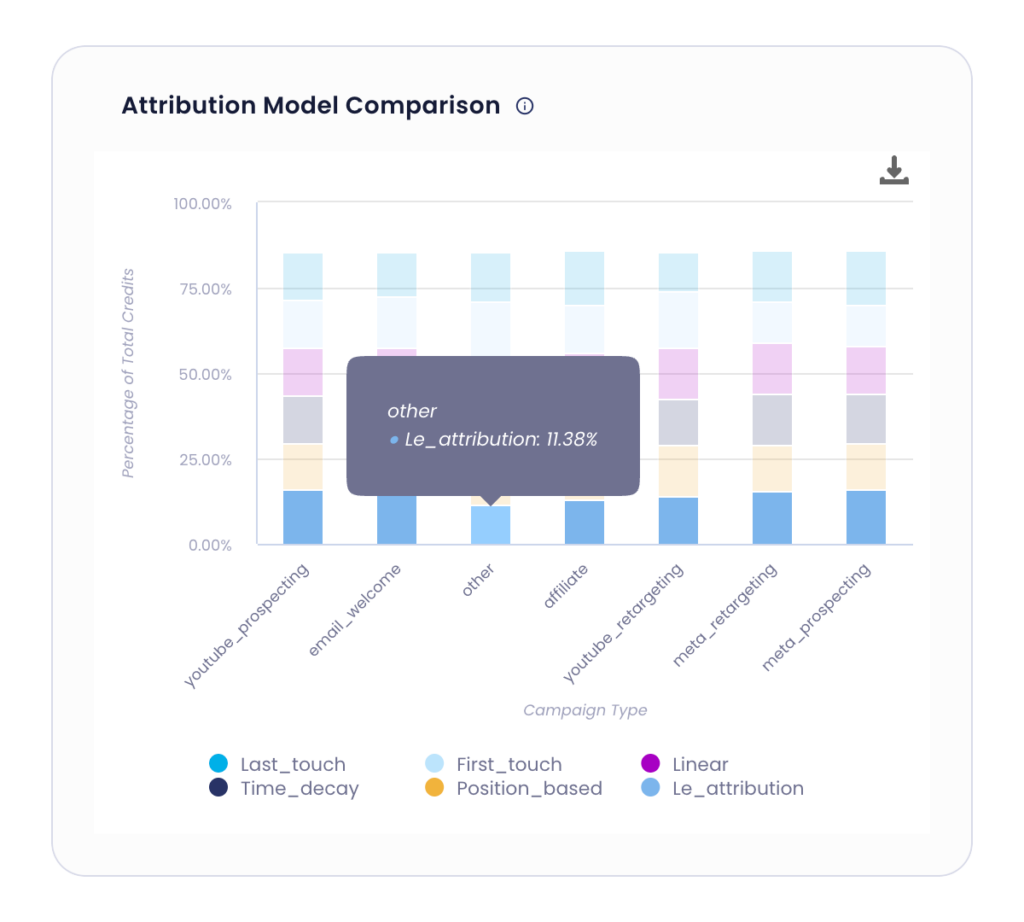
Le-Attribution (Lebesgue Model)
Le-attribution is a custom attribution model designed to favor prospecting and non-branded campaigns, emphasizing channels that attract new customers based on specific marketing knowledge and strategies.
Developed internally, Le-Attribution tailors attribution to the unique marketing objectives of a business, prioritizing channels that focus on acquiring new customers over those that engage existing ones.
Pros and Cons for Le-Attribution
Before opting for LE-Attribution, here are some key pros and cons to consider.
Pros:
- Customized Fit: Aligns attribution with your specific business goals and marketing strategies, making it highly tailored.
- Emphasizes Growth Channels: Prioritizes investment in prospecting campaigns, focusing on channels that drive new customer acquisition.
- Flexible: Can be adjusted and refined as marketing strategies evolve, providing adaptability over time.
Cons:
- Subjectivity: There’s a risk of introducing bias by overemphasizing certain channels, especially if not carefully managed.
- Complex Implementation: Requires a deep understanding of internal marketing dynamics, making it harder to set up compared to more standard models.
LE-Attribution is particularly valuable for businesses focused on rapid growth, especially those aiming to expand their customer base.
By prioritizing prospecting efforts, this model helps businesses allocate more resources toward channels that bring in new customers, making it ideal for businesses looking to scale quickly.
In e-commerce, LE-Attribution shines when entering new markets or launching new products.
It emphasizes campaigns that attract fresh customers in emerging regions or help introduce new products, ensuring marketing efforts are aligned with growth objectives.
This makes it a powerful tool for businesses seeking to maximize the impact of their marketing investments in dynamic and competitive environments.
Shapley Value Attribution
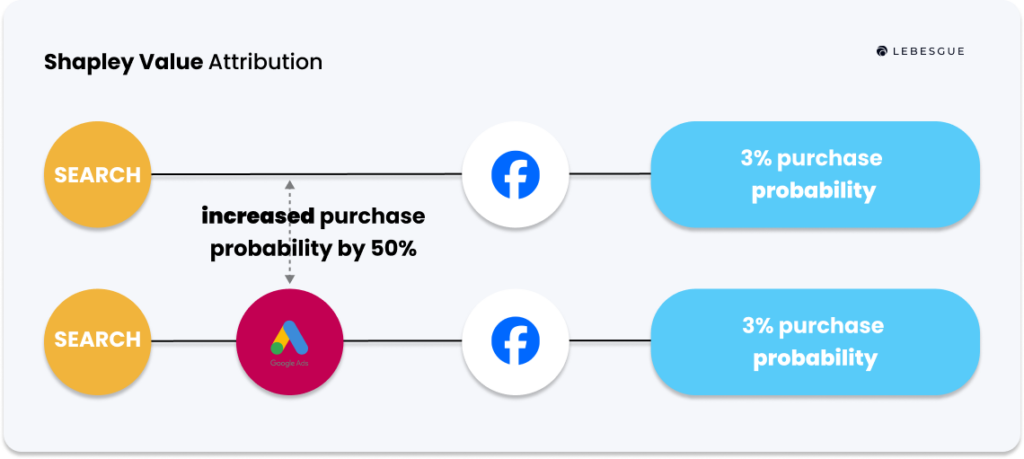
Shapley Value Attribution is an advanced attribution model derived from cooperative game theory.
It provides a fair way to distribute credit for conversion across multiple marketing channels based on each channel’s marginal contribution.
The Shapley Value method calculates the average impact of each channel by considering all possible combinations of channels and determining how much each channel contributes to the final conversion.
In essence, Shapley Value Attribution looks at every possible path a customer could take and evaluates how the inclusion of a particular channel in those paths changes the conversion outcome. This allows marketers to more accurately determine the true influence of each channel in multi-touchpoint journeys, offering a fair and data-driven approach to attribution.
How to model Shapley Value Attribution?
To implement Shapley Value Attribution effectively, follow these steps:
Identify all channels:
Start by listing all the marketing channels that could potentially influence customer journeys. This could include channels like email, social media, paid ads, organic search, and more.Gather data on customer paths:
Collect detailed data on the unique paths customers take before they convert. This means tracking the sequence and interactions of all the touchpoints (channels) a customer engages with on their way to making a purchase or completing a desired action.Calculate conversion rates:
For each possible combination of channels (subsets), calculate how many conversions occur when those channels are involved. This involves analyzing how different combinations of channels contribute to the total number of conversions.Compute marginal contributions:
For each channel, determine its marginal contribution to conversions. This is done by comparing the total conversions for every subset that includes a specific channel against the total conversions for subsets that exclude that channel. The marginal contribution is calculated as the difference between these two values, highlighting how much that particular channel adds to conversions.Calculate Shapley Value:
Finally, use the marginal contributions from each channel to calculate the Shapley Value. This value represents the fair share of credit each channel deserves for its role in driving conversions, based on its contributions across all possible combinations. The Shapley Value aggregates the contributions from all potential paths to provide a comprehensive attribution model.
Pros and cons for Shapley Value Attribution
Now that you know what Shapley Value Attribution is and how to use it, here are some advantages and disadvantages of this attribution model.
Pros:
- Fair Distribution: Shapley Value Attribution ensures that credit for conversions is equitably allocated across all marketing channels by considering all possible combinations.
- Data-Driven: This model is based on actual customer journey data, providing insights grounded in real interactions.
- Identifies Synergies: It highlights how different channels collaborate and contribute to conversions, allowing marketers to understand the interdependencies in their marketing efforts.
Cons:
- Computational Complexity: The model requires significant computational resources, especially when analyzing many channels, which can be a barrier for some organizations.
- Complexity in Explanation: Explaining the model’s methodology and results can be challenging for stakeholders who may not have a background in game theory or advanced analytics.
- Data Intensive: Shapley Value Attribution needs comprehensive data on customer interactions across all channels, which may not always be available.
In the e-commerce space, this attribution model can be applied to evaluate the impact of multi-touch campaigns, such as assessing how combined email, social media, and PPC efforts drive sales.
Additionally, it aids in customer journey analysis by providing insights into how different touchpoints collectively influence overall sales, enabling businesses to refine their marketing strategies for better results.
Markov Chain Modeling
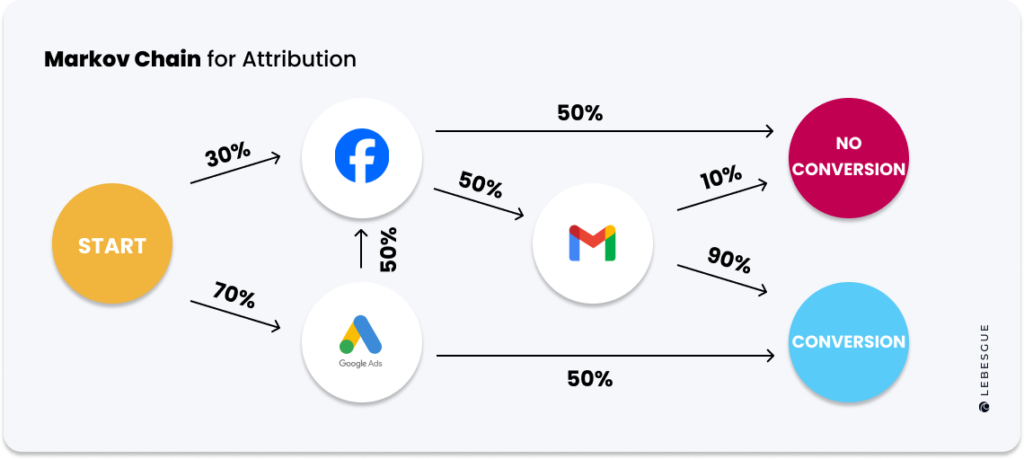
Markov Chain Modeling is a statistical approach used in marketing analytics to understand and analyze customer journeys by representing them as a sequence of states or events.
In this context, each state corresponds to a marketing channel (such as social media, email, or paid ads), and the goal is to determine how customers move between these channels before converting (making a purchase or taking another desired action).
With Markov Chain Modeling you’ll get a dynamic view of customer interactions, capturing the sequence and influence of touchpoints in the journey.
It helps understand how various channels work together to facilitate conversions and offers a more nuanced approach compared to simpler attribution models, allowing for more informed decision-making in budget allocation and marketing strategy.
How to model Markov Chain Attribution?
To model Markov Chain Attribution effectively, follow these steps.
1. Define states
In this first step, identify the different marketing channels that your customers interact with throughout their journey. Each of these channels is considered a state in the model. Additionally, include the following states:
- Start State: Represents the initial point where a customer first interacts with your marketing efforts.
- Conversion State: This is an absorbing state, meaning that once a customer reaches this point (i.e., they complete a purchase), they cannot move to any other state.
- Null or Churn State: This state captures instances where customers do not convert after interacting with your marketing channels, representing lost opportunities.
By defining these states, you create a framework for analyzing customer interactions.
2. Construct the transition matrix
Next, create a transition matrix, which represents the probabilities of customers moving from one state (channel) to another.
- Historical Data Analysis: Analyze past customer journey data to determine how often customers transition from one channel to another.
- The transition matrix P is composed of probabilities denoted as pijp_{ij}pij, where pijp_{ij}pij represents the probability of moving from state i (the current channel) to state j (the next channel).
This matrix effectively illustrates the likelihood of each possible transition, helping you understand the flow of customer interactions.
3. Calculate removal effect
For each channel (state) in the model, assess its impact by removing it from the transition matrix.
- By observing how the overall conversion probability changes when a specific channel is removed, you can determine its influence on customer conversions.
- The removal effect indicates how much the conversion probability decreases when that channel is not available in the customer journey.
This step highlights the relative importance of each channel in driving conversions.
4. Compute attribution values
Finally, compute the attribution values for each channel based on the results from the previous step.
- The contribution of each channel is calculated as the decrease in overall conversion probability when that channel is removed from the model.
- Channels that lead to a more significant drop in conversion probability are considered more influential in the customer journey.
By analyzing these values, you can better understand which channels are most effective at guiding customers toward conversion, allowing for more informed marketing decisions and budget allocations.
In summary, Markov Chain Modeling provides a comprehensive view of how different marketing channels interact with each other and contribute to the customer conversion process, enabling marketers to optimize their strategies effectively.
Pros and cons for Markov Chain Attirbution
Now that you have a better understanding of Markov Chain Modeling, let’s explore its advantages and disadvantages.
Pros:
- Sequence Analysis: Captures the order of interactions, providing insights into the dynamics of customer journeys.
- Removal Effect: Identifies how the absence of a channel impacts overall conversions.
- Scalability: More computationally efficient than models like Shapley Value when working with numerous channels.
Cons:
- Assumption of Markov Property: Assumes that the next state depends only on the current state, which may not always reflect real customer behavior.
- Data Requirements: Requires extensive data to accurately estimate transition probabilities.
- Complex Implementation: Demands expertise in stochastic modeling, which may pose a barrier for some teams.
In the e-commerce space, Markov Chain Modeling aids in path analysis, enabling businesses to identify the most common paths leading to purchase. It also evaluates channel interaction effects, providing insights into how different channels influence customer movement through the sales funnel.
Summing Up
In summary, attribution is essential for understanding how your marketing efforts lead to conversions. It helps you see which channels are effective and how they contribute to your overall success.
Different attribution models—like First Click, Last Click, Time Decay, U-Shaped, Le-Attribution, Shapley Value, and Markov Chain—provide unique insights, leading to different conclusions about where to focus your resources.
By selecting the right attribution model, you can improve your marketing strategy, better engage customers, and increase conversions.