When it comes to e-commerce marketing, there’s no shortage of metrics to track. From click-through rates and conversion rates to customer acquisition costs and ROAS, the list is long—and it can get overwhelming fast. So how do you know which metrics truly matter? Which ones actually reflect the real state of your marketing performance? One metric that’s gained a lot of attention recently is MER, or Marketing Efficiency Ratio.
While platform-specific KPIs like ROAS (Return on Ad Spend) often dominate dashboards, they rarely tell the full story. That’s where MER steps in. It’s a simple yet powerful metric that cuts through attribution noise and answers a critical question: Is your overall marketing spend driving profitable growth?
Whether you’re an eCommerce brand grappling with rising ad costs or a marketer searching for a more holistic performance indicator, MER offers clarity—and often reveals insights that other metrics miss.
What is MER in Marketing?
MER stands for Marketing Efficiency Ratio, and it’s one of the most straightforward yet insightful metrics for understanding your overall marketing performance.
The formula for Marketing Efficiency Ratio is MER = Total Revenue/Total Ad Spend
That’s it—simple math with powerful implications.
For example, if you made $100,000 in revenue last month and spent $20,000 on marketing, your MER would be 5.0. That means for every $1 you spent on ads, you generated $5 in revenue.
Unlike ROAS, which looks at returns from a single platform or campaign, MER takes a step back and looks at the bigger picture. It includes all your ad spend across channels and compares it against total revenue—regardless of attribution.
This makes MER particularly valuable for:
Brands running multi-channel marketing strategies
Navigating attribution issues post-iOS 14.5
Understanding overall efficiency, not just channel performance
If you want a single number that tells you how well your marketing is converting spend into revenue—without the noise of attribution windows or channel-specific reporting—MER is your go-to metric.
How MER Compares to Other Marketing Metrics?
While traditional metrics like ROAS, CAC, and LTV each offer valuable insights, MER stands out for its simplicity and big-picture perspective.
ROAS focuses on individual platform performance, CAC tells you how much it costs to acquire a single customer, and LTV measures the long-term value of that customer.
But MER cuts across all of them, showing how efficiently your total marketing investment turns into total revenue—regardless of where those sales came from. It doesn’t replace channel-specific metrics, but it complements them by helping you understand if your overall strategy is actually profitable and scalable.
| Metric | Limitation | Description |
|---|---|---|
| MER | Doesn’t show revenue source | MER offers no visibility into which platforms or campaigns drove sales—it just shows total efficiency. |
| ROAS | Platform attribution bias | ROAS often reflects what ad platforms *claim* they drove, even when attribution overlaps or fails. |
| CAC | Ignores customer value | CAC tells you the cost to acquire a customer, but doesn’t factor in whether that customer is profitable over time. |
| LTV | Hard to predict accurately | LTV is based on historical data and can be skewed by short-term behavior, churn, or limited repeat purchase cycles. |
How MER Differs from ROAS?
At first glance, MER and ROAS (Return on Ad Spend) might seem similar—they both measure how much revenue you earn from your advertising.
But in practice, they serve very different purposes and tell very different stories.
ROAS: Channel-Specific and Granular
ROAS measures the return on ad spend within a single platform or campaign. It’s calculated as:
ROAS = Ad Spend for that Campaign / Revenue Attributed to Campaign
This makes ROAS useful for:
Optimizing specific ads or platforms (e.g., Meta, Google)
Making in-platform decisions
Testing creative and audience performance
But here’s the catch: ROAS only tells you what the platform thinks it drove. It doesn’t account for:
Attribution delays or mismatches
Influences from other channels
Brand awareness or organic impact
MER: Holistic and Attribution-Agnostic
So, MER takes all marketing spend and compares it to total store revenue, no matter where that revenue came from.
This makes MER useful for:
Evaluating your entire marketing ecosystem
Understanding overall profitability
Making strategic decisions like budgeting or scaling
MER includes sales from:
Paid and organic sources
Influencer marketing
Email and SMS
Direct and returning customers
It captures the full picture—even if attribution is messy.
| Metric | Scope | Strength | Weakness |
|---|---|---|---|
| ROAS | Channel-level | Great for granular optimizations | Limited by attribution, doesn’t show full performance |
| MER | Business-wide | Holistic, clear on total efficiency | Doesn’t isolate which channels perform best |
Why Use MER?
With so many performance metrics out there, you might be wondering: Why does MER matter so much? The answer is simple—MER cuts through the noise and gives you a true picture of how efficiently your marketing is performing across all channels, not just what platforms tell you.
Here are some of the biggest reasons why marketers and e-commerce brands are increasingly relying on MER:
- It reflects true business performance
- It solves the attribution problem
- It’s perfect for budgeting and scaling
- It’s directly linked to profitability
- It encourages smarter marketing
It Reflects True Business Performance
While ROAS can look great inside Meta Ads Manager or Google Ads, those numbers often ignore the full customer journey.
MER, on the other hand, includes all your revenue—whether it came from paid ads, email, SEO, or even word-of-mouth.
That means you’re tracking how your business is actually doing, not just what one ad platform reports.
It Solves the Attribution Problem
Modern eCommerce brands advertise on multiple platforms (Meta, Google, TikTok, etc.), but tracking user journeys across channels is increasingly difficult, especially post-iOS 14.5 and with browser privacy updates.
Platforms tend to over- or under-credit certain conversions. MER bypasses all that.
Since it compares total revenue to total ad spend, there’s no need to rely on messy attribution models.
You’ll always have a clear, unbiased snapshot.
It’s Perfect for Budgeting and Scaling
Trying to figure out if you can afford to scale your ad spend? MER helps you answer that.
A healthy MER means you have room to grow profitably. A declining MER might signal it’s time to pause and optimize. It’s an essential tool for:
Forecasting spend
Planning promotions
Adjusting acquisition costs
It’s Directly Linked to Profitability
Every business has a breakeven MER—the point at which revenue just covers your ad spend, product costs, and overhead.
Knowing your current MER compared to your breakeven point gives you immediate insight into whether you’re profitable or not.
It’s like a profitability pulse check.
It Encourages Smarter Marketing
Because MER is holistic, it rewards strategies that improve overall efficiency—not just those that perform well on paper. That means:
Better landing pages
Smarter email follow-ups
Stronger retention efforts
These things might not show up in ROAS, but they do show up in MER.
If you want one metric that keeps your marketing grounded in reality and focused on sustainable growth, it’s MER.
It doesn’t care where the sale came from—it only cares whether your marketing spend is paying off.
Best Practices for Using MER
Now that you understand what MER is and why it’s important, let’s talk about how to actually use it in a smart and effective way. MER is simple to calculate, but interpreting it correctly and using it to guide decisions takes a little more strategy.
Here are some of the best practices to make the most out of MER in your eCommerce marketing:
Track It Regularly (Weekly or Monthly)
MER is most powerful when viewed over time. Instead of just checking it at the end of the month, make it a habit to monitor it weekly (or even daily during high-spend periods).
Look for trends, not just one-off spikes
Set benchmarks for different seasons, promos, or product launches
💡 Pro tip: A sudden drop in MER can be an early warning sign that your ad costs are rising faster than your revenue.
Pair It with CAC and LTV
MER on its own shows efficiency—but when you combine it with Customer Acquisition Cost (CAC) and Customer Lifetime Value (LTV), you get a full profitability picture.
High MER + Low CAC = ideal for scale
Low MER + High LTV = okay if you recoup revenue over time
Know Your Breakeven MER
This is crucial. Your breakeven MER is the ratio at which your business covers its costs (COGS, shipping, team, tools, etc.). Anything above that is profit. Anything below means you’re losing money—even if platform ROAS looks fine.
For high-margin products, your breakeven MER might be low (e.g. 2.0–2.5)
For low-margin or heavily discounted products, you may need a higher MER to stay profitable
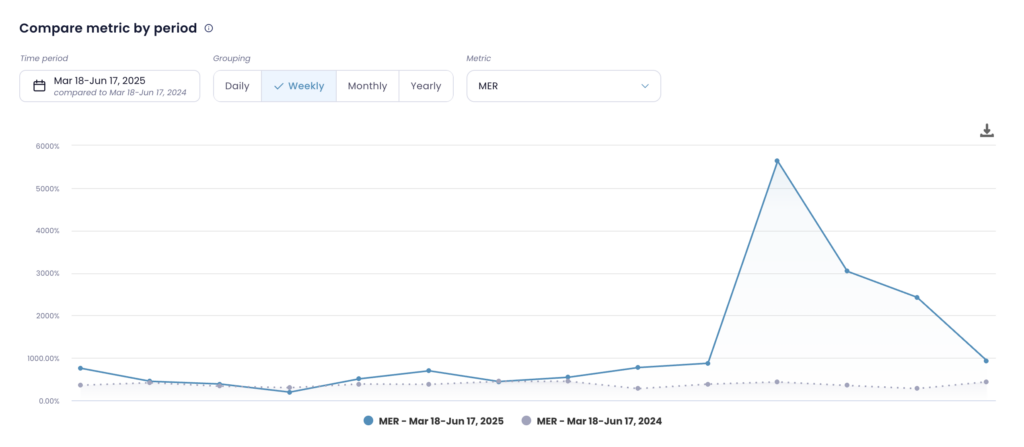
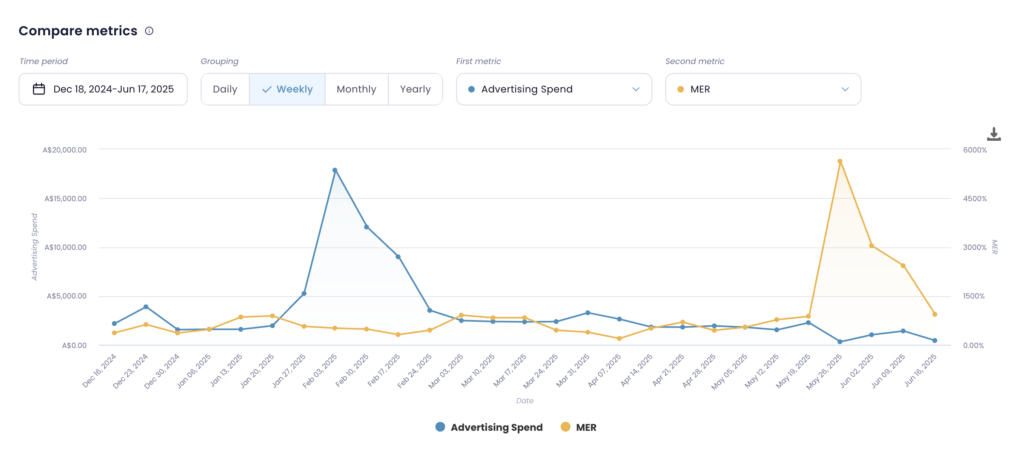
Visualize It Alongside Revenue and Spend
Don’t just track MER as a standalone number—plot it alongside your total ad spend and revenue to get deeper insights.
This helps you clearly understand how efficiently your marketing is scaling and whether higher spend is actually delivering proportional returns.
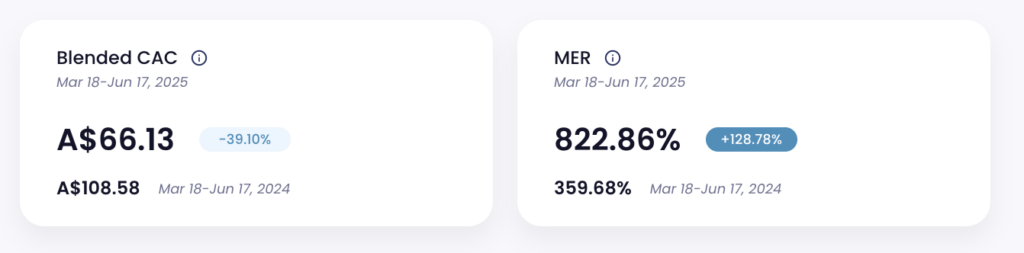
One of the best ways to do this is with Lebesgue: AI CMO. It gives you a complete picture of your marketing performance, allowing you to:
Automatically calculate and monitor MER
Compare it to your breakeven threshold
Spot changes in efficiency across time and campaigns
Layer in CAC, LTV, and margin data for full-context decision making
You can also set this up in a simple Google Sheet—but using an AI-driven tool like Lebesgue: AI CMO will save time, reduce errors, and provide proactive recommendations.
Limitations of MER
While MER (Marketing Efficiency Ratio) is a powerful metric for understanding your overall marketing performance, it’s not without its limitations.
Like any metric, it’s most effective when used in context—alongside other KPIs and business data.
Here are some key things to keep in mind:
MER Doesn’t Tell You Where the Revenue Came From
MER shows how efficiently your total ad spend is converting into revenue—but it doesn’t tell you which specific channels, campaigns, or audiences are performing best.
You might have a high MER overall, but not realize that one platform is underperforming
It can’t pinpoint creative fatigue, platform inefficiencies, or wasted budget
Solution: Use MER for big-picture strategy, and pair it with channel-level ROAS or platform dashboards for tactical decisions.
It Includes Revenue From Non-Marketing Sources
Because MER compares all revenue against all ad spend, it includes revenue from:
Returning customers
Organic traffic
Email or SMS flows
Brand equity and word-of-mouth
This can inflate your MER if a large portion of your revenue is non-paid, making your performance look more efficient than it actually is—especially if you’re scaling acquisition efforts.
Solution: Segment out new vs. returning customer revenue if possible, or use a “new customer MER” to get a clearer view of acquisition efficiency.
It Can Look Misleading During Promotions or Sales
Running a heavy discount or big sale might spike your revenue, driving up your MER.
But that doesn’t mean you’re more profitable—especially if margins are tight.
Solution: Always interpret MER in context of margin and breakeven point, and compare it across similar time periods (e.g. YoY during Black Friday).
MER Isn’t Real-Time or Campaign Responsive
MER is lagging, not leading. It shows how your overall marketing worked across a time period, but it doesn’t react in real time.
It won’t help you test ad creatives
It won’t tell you if this week’s new campaign is working or not
Solution: Continue using short-term ROAS and CTRs to evaluate immediate performance, and use MER for weekly or monthly reviews.
MER is not meant to replace all other metrics—it’s meant to anchor them. Use it to guide direction, not to micro-manage execution.
When used in combination with channel insights, LTV data, and customer segmentation, MER becomes one of the most powerful tools in your marketing toolbox—but only if you understand its limitations.
How Le Pixel Enhances MER Tracking
While MER is simple in theory, tracking it consistently and accurately can be tricky—especially when your data comes from multiple platforms. That’s where Le Pixel by Lebesgue makes a real difference.
Le Pixel collects clean, first-party data and gives you a reliable view of revenue attribution—free from platform bias or tracking limitations. When combined with your ad spend data, it lets you:
Automatically calculate MER in real-time
See how new vs. returning customers are affecting your performance
Accurately track the impact of organic, email, and paid campaigns
Spot drop-offs in efficiency before they hurt your bottom line
Summing Up
With so many metrics to track, it’s easy to get caught up in platform data and lose sight of the bigger picture. MER (Marketing Efficiency Ratio) brings things back to what really matters: Are your marketing efforts turning into actual revenue?
Unlike ROAS, CAC, or LTV—which each zoom in on one part of the story—MER gives you a clear, high-level view of how efficiently your total ad spend is working across all channels. It’s simple, honest, and cuts through the noise.
Yes, it has its limitations. No single metric tells you everything. But when you use MER consistently—alongside other data like CAC, LTV, and margin—it becomes a powerful tool for making better decisions, spotting issues early, and scaling your brand with confidence.
If you’re serious about profitable e-commerce growth, MER deserves a permanent spot on your dashboard.