Cohort analysis helps Shopify store owners understand customer retention by tracking how different groups (like first-time buyers in a specific month) behave over time.
This reveals patterns in repeat purchases, highlights when customers tend to drop off and informs targeted retention strategies, such as re-engagement emails. It also shows which acquisition channels bring the most loyal customers, helping optimize marketing spend.
By identifying high-value customers and peak drop-off points, cohort analysis directly supports strategies to increase lifetime value and long-term profitability.
So, in this blog post we’ll cover what cohort analysis is, why is important for Shopify businesses, and how you can use it to grow your store.
What is a cohort?
In the context of a Shopify store, a cohort refers to a specific group of customers who share a common characteristic or behavior, often related to their purchase or engagement patterns.
Shopify store owners use cohort analysis to track how groups of customers behave over time, which helps them understand customer retention, lifetime value, and purchase frequency.
By analyzing cohorts, Shopify store owners can identify patterns that indicate successful campaigns, strong products, or effective onboarding strategies.
This insight allows you to make data-driven adjustments to improve customer loyalty, increase repeat purchases, and refine their marketing efforts to target customers more effectively.
What is a cohort analysis?
Now that we’re familiar with the meaning of cohorts, let’s explain how you can analyze it.
Cohort analysis is a method of studying specific groups of users (or “cohorts”) who share common characteristics or experiences within a set time frame, to understand how their behavior changes over time. The goal is to analyze how each cohort interacts with a product, service, or campaign, allowing businesses to identify trends, measure customer retention, and optimize strategies for better performance.
In practice, cohort analysis can help answer questions like:
- Retention and churn: Are customers acquired in January more likely to make repeat purchases than those acquired in February?
- Engagement over time: How often do customers come back and make additional purchases after their first interaction?
- Marketing campaign performance: How does the behavior of users who joined through a specific campaign differ from those acquired organically?
For example, in a Shopify store, you might group customers by their first purchase month (an acquisition cohort).
Tracking these cohorts can reveal insights such as whether a January cohort is more loyal than a February cohort, which can help you identify successful promotional strategies or seasonal impacts.
Cohort analysis is especially valuable for e-commerce, as it provides insight into customer behavior, loyalty, and lifetime value. This information helps to develop strategies for retaining customers, improving lifetime value, and tailoring marketing efforts to the most promising customer segments.
Cohort analysis and retention strategy
Cohort analysis is crucial for customer retention because it allows businesses to track how different groups of customers behave over time, revealing patterns that are often hidden in aggregated data.
Here’s why cohort analysis is so valuable for improving retention:
- Identifies retention trends
- Informs targeted retention strategies
- Tracks the impact of marketing and retention efforts
- Improves customer lifetime value
- Provides actionable insights for product improvements
- Builds a data-driven retention roadmap
Cohorts with strong repeat purchase rates or high order values indicate a higher lifetime value. With those insights, you can invest more resources in retaining these high-value cohorts through loyalty programs or exclusive deals.
Retaining more high-value customers directly increases customer lifetime value, which is a key driver of long-term profitability.
By understanding the behaviors, trends, and specific needs of different customer cohorts, you can create personalized retention strategies and proactively address issues that may cause customers to leave.
How to do cohort analysis?
To perform cohort analysis, you follow a structured approach to segment data, define metrics, and interpret trends.
Here’s a step-by-step guide to conducting cohort analysis, which you can apply to various tools, including Shopify, Google Analytics, or custom data solutions:
- Define the cohorts
- Choose the metrics
- Gather data
- Create a cohort analysis table
- Visualize the data
- Analyze and interpret the results
- Implement changes and monitor
1. Define the cohorts
To define cohorts for a Shopify store, start by deciding what type of customer cohort you want to track, which will depend on your goals:
First step is to choose a cohort type. Think about what customer actions you want to analyze. Common cohort types include:
- Acquisition Cohort: This groups customers by when they made their first purchase, such as by month or quarter (e.g., all customers who made their first purchase in January 2024). This type is helpful for tracking customer retention over time.
- Behavioral Cohort: This groups customers based on specific actions or behaviors, like all customers who added a product to the cart but didn’t buy, or customers who responded to a specific ad campaign. This type helps analyze specific customer behaviors and their impact on sales.
The next thing to do is to set a time frame. Decide the period you want to monitor each cohort’s behavior, which is typically tied to your business cycle.
For example, you might track monthly behavior for customers in an acquisition cohort to see their repeat purchase rates over several months.
2. Choose the metrics
To effectively analyze your cohorts, select specific metrics that reflect your business goals and customer behavior. The metrics should reveal valuable insights about your cohorts. Here are the important metrics for defining your cohorts:
- Retention Rate: Track the percentage of customers in each cohort who make repeat purchases, which shows how well you’re retaining them over time.
- Churn Rate: Measure the percentage of customers who don’t return after their first purchase to understand where you may be losing them.
- Average Order Value (AOV): Calculate the average spend per order in each cohort to gauge revenue potential and purchasing behavior.
- Customer Lifetime Value (CLV): Estimate the total revenue each cohort is expected to generate over time, which helps assess long-term profitability.
Make sure each metric supports your specific goals, like improving retention or increasing revenue. For example, if your goal is to boost repeat purchases, focus on tracking retention rate and CLV.
3. Gather data
If you’re using Shopify or an analytics tool like Google Analytics or a CRM (such as Klaviyo), you can export customer data, which typically includes information like purchase history, first purchase date, and other relevant behavioral details.
Some tools, like Shopify, also offer cohort reporting features directly within their dashboards, which can save you time.
After exporting this data you need to segment them by cohorts and time frames.
Organize the exported data by grouping customers based on the cohort type you’ve defined (e.g., first purchase month or a specific behavior like adding to cart). Then, break this data down by time frames, such as tracking how each cohort behaves in week 1, week 2, or month 1, month 2 after their first purchase. This segmentation helps you analyze how customer behavior evolves over time within each cohort.
4. Create a cohort analysis table
To create a Cohort Analysis Table, follow these steps:
Set up a table:
- Rows: Each row represents a different cohort. For example, if you’re using an acquisition cohort, each row will correspond to a group of customers who made their first purchase in a specific month (e.g., January 2024, February 2024, etc.).
- Columns: Each column represents a successive time period after the initial action. For example, you can track behavior over weeks or months. In the case of an acquisition cohort, columns could represent the percentage of customers returning in Week 1, Week 2, Month 1, Month 2, etc.
Fill in the metrics:
- For each cohort and time period, calculate the relevant metrics. If you’re tracking retention rate, for example, calculate the percentage of customers in the cohort who made repeat purchases in each successive time period. For churn rate, calculate the percentage of customers who didn’t return after their first purchase.
- You might also track the Average Order Value (AOV) or Customer Lifetime Value (CLV) for each cohort at different time intervals to analyze revenue trends.
Here’s an example of what the table could look like for an acquisition cohort:
Time Period
Cohort
Month 1
Month 2
Month 3
Month 4
January
60%
50%
45%
38%
February
55%
48%
43%
36%
March
62%
55%
50%
43%
This monthly format is great for understanding long-term customer behavior, such as:
- How many customers remain active after the first month, second month, etc.
- Trends in customer retention over time.
- Whether your marketing and retention strategies are impacting long-term loyalty.
By using months, you can also track seasonal changes, like how customer retention behaves during peak months (e.g., holidays or Black Friday) versus slower months.
5. Visualize the data
To visualize cohort analysis data effectively, you can use heatmaps or line charts. Both methods allow you to spot trends, patterns, and anomalies, helping you interpret your data more easily.
A heatmap visualizes your data with color gradients, where higher values are typically shown in darker shades (e.g., dark green) and lower values in lighter shades (e.g., light yellow or red). This makes it easy to identify patterns at a glance.
Line charts are ideal for visualizing trends over time, such as retention rates or Average Order Value (AOV) for each cohort. They allow you to compare different cohorts at a glance and track how behavior evolves month by month.
By using heatmaps and line charts, you can quickly interpret the trends, identify where your cohorts are dropping off, and make informed decisions about retention and marketing strategies for your Shopify store.
6. Analyze and interpret results
When analyzing cohort data, your primary goal is to understand how customer behavior evolves over time. Here’s how to identify key trends:
Gradual drop-off in retention: If you notice a consistent decline in retention for each cohort (e.g., retention decreases month after month), this suggests that customers are likely disengaging after their initial purchase. This is typical, but it also indicates that your retention efforts may need improvement.
Consistent high retention: If a specific cohort, such as one acquired in a particular month or via a certain channel, shows strong retention rates month-over-month, it signals that this group is more engaged and loyal. These cohorts are your best customers, and you should investigate what might have led to their higher engagement.
Spikes or Anomalies in Retention: A sudden increase in retention or average order value (AOV) for a specific cohort could indicate an anomaly, such as a successful marketing campaign, a new product release, or a seasonal effect. Anomalies like this are worth exploring further, as they can highlight areas for opportunity.
Example:
- Cohort 1 (January): Shows a consistent drop from 60% retention in Month 1 to 38% by Month 4.
- Cohort 2 (February): Slightly lower overall retention compared to January, but follows a similar downward trend.
- Cohort 3 (March): Shows higher retention across all months, with a drop from 62% in Month 1 to 43% in Month 4, indicating better customer loyalty.
Trend Identified: Cohort 3 (March) is showing stronger retention than the other two cohorts, which suggests that customers from this cohort are more loyal.
6. Implement changes and monitor
Once you’ve analyzed your cohort data and identified actionable insights, it’s time to apply these findings to improve your customer retention strategies, optimize campaigns, or increase customer lifetime value (CLV). Here’s how to implement the changes:
Focus on high-performing cohorts: If a specific acquisition channel (e.g., organic traffic, email marketing) or campaign (e.g., referral programs, seasonal discounts) yielded high-retention cohorts, you should invest more resources into these areas. For example, if Cohort 3 (March) showed higher retention due to a specific marketing campaign, you could apply the same campaign tactics to new cohorts to replicate the success.
Improve at-risk Cohorts: If certain cohorts are showing a sharp decline in retention (e.g., Cohort 1 (January) with a rapid drop from 60% to 38%), consider implementing targeted strategies to improve their engagement. This could involve personalized email follow-ups, special offers, or loyalty programs aimed at re-engaging customers who haven’t returned for a second purchase.
Optimize campaigns: Based on cohort analysis, you might adjust your marketing strategies. For instance, if paid ads aren’t bringing high-retention customers, you could shift more of your budget towards channels like organic search or email marketing, where cohorts show better engagement.
Focus on customer lifetime value: If you identify cohorts that tend to spend more over time, develop strategies to increase the AOV (average order value) for those groups. Upselling, cross-selling, and targeted offers are all ways to drive up CLV, particularly for the high-retention cohorts
Cohort analysis is not a one-time task; it’s an ongoing process that should be repeated regularly to ensure that your strategies are working and evolving as customer behavior changes.
Cohort analysis for Shopify store
Cohort analysis for a Shopify store is a method of analyzing and grouping customers based on shared characteristics or behaviors to understand their actions over time.
In essence, cohort analysis helps you track how different customer groups perform over time, which can be invaluable for optimizing retention strategies, improving customer experience, and ultimately increasing revenue for your Shopify store.
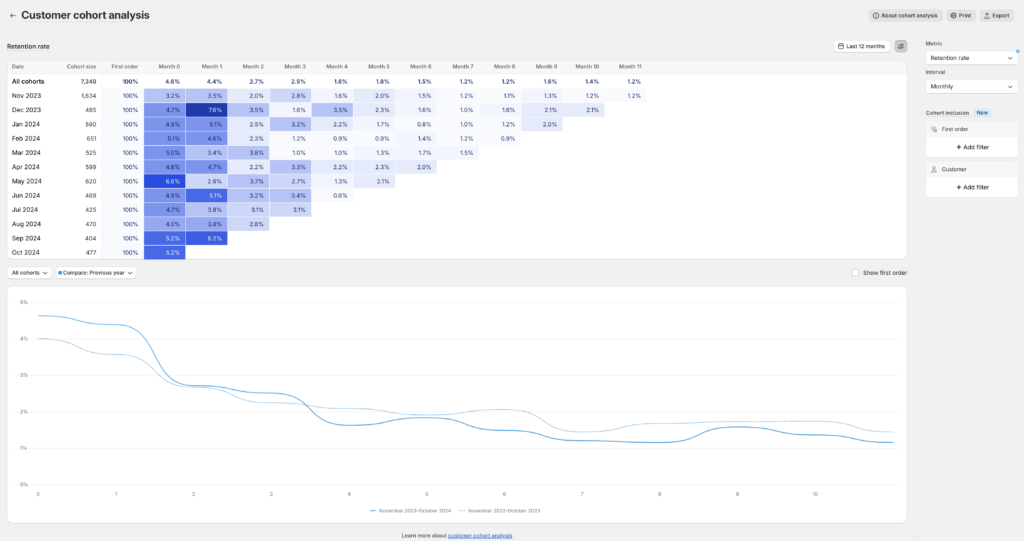
Shopify does provide a Cohort Analysis table that enables you to track customer behavior over time based on their first purchase. This table allows you to analyze repeat purchases, customer retention, and other key metrics for different customer groups (cohorts).
You can customize your cohort analysis report in various ways:
- Time period: Adjust the time period for how cohorts are grouped (e.g., weekly, monthly).
- Filters: Apply filters to select which customers are included, such as first order filters or customer-based filters.
- Predicted metrics: Use predicted values for metrics like amount spent per customer.
- Cumulative vs non-cumulative: Display data either cumulatively (total over time) or non-cumulatively (separate periods).

Cohort analysis in Lebesgue: AI CMO
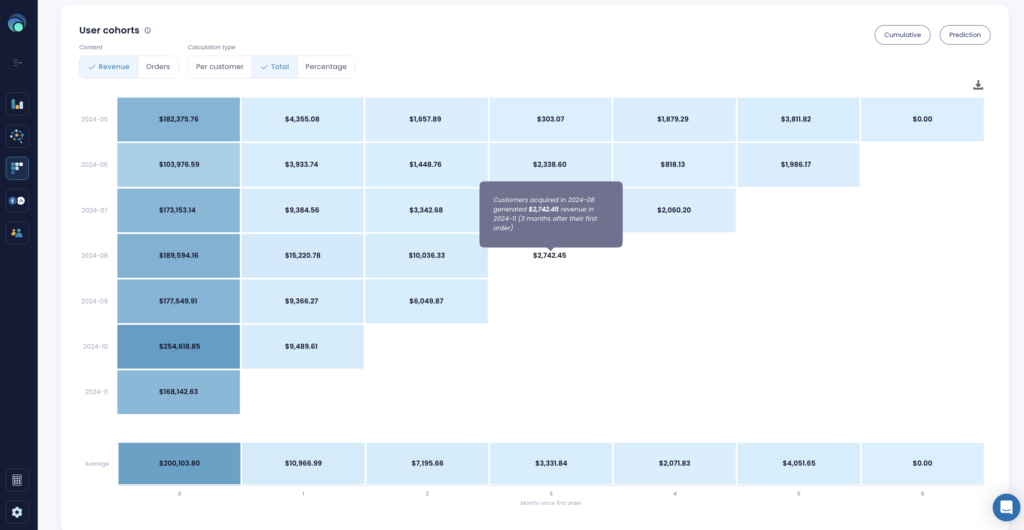
If you’re looking for a more detailed cohort analysis than what Shopify offers, you can use Lebesgue: AI CMO. The app allows you to track customer behavior over time, including how often they reorder, the revenue they’ve generated over 6 or 12 months, and their retention patterns.
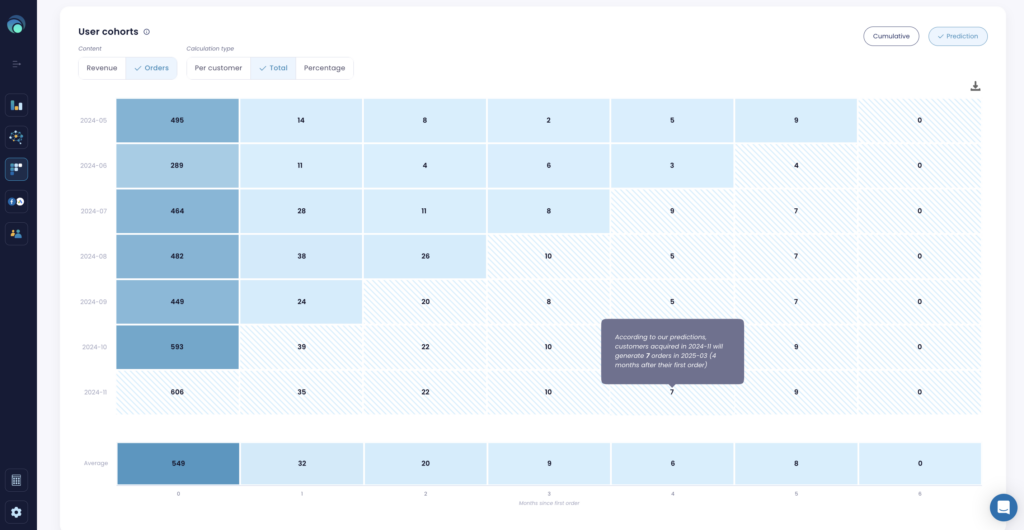
You can filter cohorts by revenue or orders, and view the data both in total and as a percentage per customer.
Also you can see the cumulate and prediction of your cohorts. The Cumulative view shows the total revenue or orders generated by each cohort, while the Prediction view provides a powerful statistical model to forecast future customer behavior.
Additionally, Lebesgue: AI CMO calculates the average based on all selected cohorts, with a higher weight given to more recent data for better relevance.

You should filter cohorts by orders when you want to understand customer behavior based on the volume of purchases, which is useful for evaluating how often customers return and how frequently they make repeat purchases. This is particularly helpful if you’re focused on driving repeat sales or assessing the impact of your retention efforts.
On the other hand, filter cohorts by revenue when you want to track the monetary value generated by each cohort. This is important for understanding which customer groups are more profitable and how different cohorts contribute to your overall revenue. It gives a clearer picture of customer value beyond just the frequency of orders, especially if you want to optimize for high-spending customers.
As for predictions, they are crucial because they help you anticipate future customer behavior, such as how much revenue or how many orders a cohort will generate over the next 6, 12, or 24 months.
This allows you to make informed decisions about budgeting, marketing, and resource allocation. Knowing how your cohorts are likely to behave helps you plan for the future and focus your efforts on high-potential groups, ensuring you’re maximizing long-term growth and customer lifetime value.

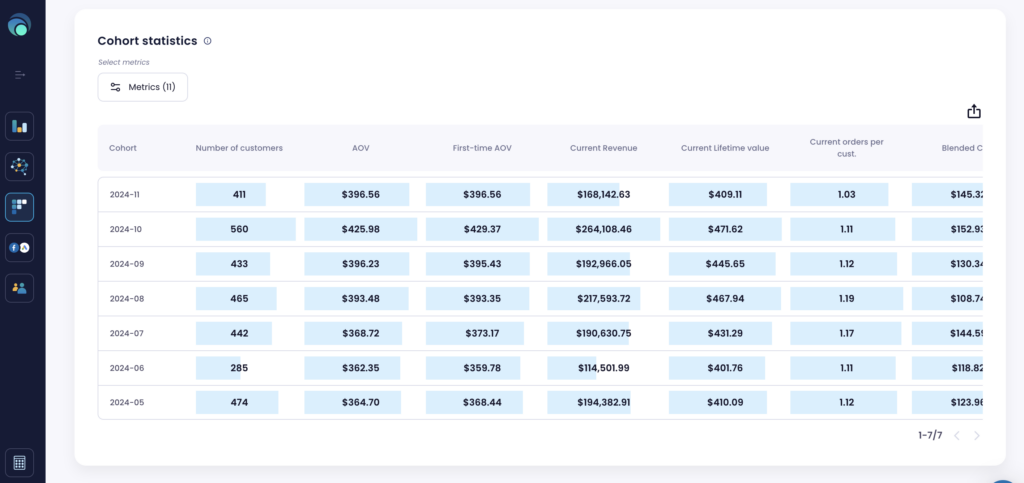
What is cohort statistics?
Cohort statistics refers to the data and metrics used to analyze and track the behavior of specific groups (or cohorts) of customers over a defined period of time.
These cohorts are typically grouped based on shared characteristics, such as when they made their first purchase or how they interacted with a specific marketing campaign. By analyzing cohort statistics, businesses can better understand customer retention, purchasing habits, and long-term value.
Common cohort statistics include:
- Retention rate: Measures how many customers from a specific cohort return to make additional purchases over time.
- Churn rate: Tracks the percentage of customers who stop making purchases after their initial one.
- Average order value (AOV): Calculates the average spend per order within the cohort, helping businesses assess how much revenue is generated per customer.
- Customer lifetime value (CLV): Estimates the total revenue a customer from a specific cohort is expected to generate during their lifetime.
- Revenue per Ccohort: Tracks the total revenue generated by a cohort over time.
- Frequency of purchase: Measures how often customers from a cohort make repeat purchases.

These statistics help businesses identify trends, optimize marketing efforts, and improve customer retention strategies by providing insights into how different cohorts behave and what drives their purchasing decisions.
Summing up
Having the correct cohort analysis for your Shopify store is crucial because it helps you understand how different groups of customers behave over time, allowing you to make data-driven decisions.
By analyzing cohorts—such as customers who made their first purchase in a specific month or quarter—you can track key metrics like retention rates, lifetime value (LTV), and repeat purchase behavior.
Without accurate cohort analysis, you risk misallocating your marketing budget, missing out on loyal customers, or failing to spot trends that could drive more revenue. Ultimately, it helps you improve customer retention, predict future behavior, and allocate resources where they’ll have the greatest impact on your store’s growth.
Frequently Asked Questions about cohort analysis
Cohort analysis is important because it helps you understand customer behavior trends over time. By analyzing different customer groups, you can identify which segments are most valuable, optimize your marketing efforts, improve retention strategies, and ultimately increase revenue and profitability.
In Shopify, cohorts can be created by segmenting customers based on the time of their first purchase, purchase behavior, or other defining actions. You can then track metrics like retention rates, average order value (AOV), and customer lifetime value (LTV) to measure their performance over time.
Key metrics to focus on include:
- Retention Rate: The percentage of customers who return for additional purchases.
- Lifetime Value (LTV): The total revenue generated by a customer over their relationship with your store.
- Average Order Value (AOV): The average spend per order for customers in a cohort.
- Customer Acquisition Cost (CAC): The cost of acquiring new customers in a given cohort.
- Churn Rate: The percentage of customers who do not make repeat purchases.
Predictions allow you to forecast future customer behavior based on current cohort trends. This can help you anticipate things like expected revenue, customer lifetime value (LTV), and retention over the next 6, 12, or 24 months, enabling you to make better-informed decisions about marketing, inventory, and budgeting.
Yes! By analyzing cohorts, you can determine which marketing campaigns or channels are driving the most valuable customers. This allows you to allocate your marketing budget more effectively and optimize future campaigns for higher ROI.
Cohort analysis helps you identify which customer segments are at risk of churning and which ones are more loyal. With this information, you can tailor retention strategies, such as personalized emails or exclusive offers, to keep customers engaged and encourage repeat purchases.


