For US-based ecommerce brands selling globally, international markets can become an important source of growth. But when you start investing more heavily in paid acquisition in a specific market, understanding what that investment is actually contributing isn’t always straightforward.
This summer, we ran a market-level experiment for a US-based ecommerce store with customers across global markets. From July 22 to September 3, we put dedicated Meta spend behind the United Arab Emirates while using Singapore and Switzerland as comparison markets.
During the test period, we spent $6,695 on Meta ads in the UAE. Revenue from the market reached $23,344, up 200.6% compared with the previous period.
At first glance, the conclusion seems simple: Meta ads drove the growth.
But revenue increasing after you launch ads doesn’t mean the ads caused all of that growth.
Customers may have purchased anyway. Demand may have increased across the business. A promotion may have contributed to the lift. Or other marketing channels may have played a role.
So the question we wanted to answer was more specific:
How much of the growth in the UAE was actually incremental and likely wouldn’t have happened without the dedicated Meta campaigns?
To get closer to an answer, we compared UAE performance with Singapore and Switzerland and then cross-checked the geo-based results against first-party attribution data from Le Pixel.
The experiment gives us a useful look at Meta Ads incrementality, while also offering practical insights for US ecommerce brands investing in international markets.
How we tested Meta Ads incrementality
The UAE was our treatment market. Singapore and Switzerland served as comparison markets because they were not actively targeted with the same dedicated Meta campaigns during the test period.
Rather than relying on one measurement method, we looked at the experiment from several angles:
- Shopify revenue to understand what actually happened at the store level
- First-time customer revenue to see how much revenue came from new customers
- Comparison-market performance to estimate what may have happened without the dedicated UAE campaigns
- Weekly performance to understand how the estimated lift changed throughout the experiment
- Le Pixel attribution to compare first-party attributed revenue with the geo-based estimates
This distinction is important because attribution and incrementality don’t answer the same question.
Attribution tells us which marketing interactions receive credit for a conversion.
Incrementality asks whether that conversion would have happened without the marketing activity.
That’s the question the geo test was designed to help us answer.
UAE revenue increased 200%
The initial results were strong.
During the test period, the UAE generated $23,344 in revenue, compared with $7,766 during the previous period.
| Metric | Previous period | Test period | Change |
|---|---|---|---|
| Revenue | $7,766 | $23,344 | +200.6% |
| Orders | 12 | 39 | +225.0% |
| First-time revenue | $3,963 | $18,422 | +364.8% |
| First-time orders | 7 | 30 | +328.6% |
But one number stood out even more than total revenue growth.
Of the $23,344 generated in the UAE, $18,422 came from first-time customers.
That’s nearly 79% of total revenue.
For a campaign focused on customer acquisition, that’s an important signal. The increase wasn’t primarily coming from existing customers returning to make another purchase. A significant share of the revenue came from customers purchasing from the brand for the first time.
Still, a 200% increase in revenue doesn’t mean Meta created 200% growth.
To understand why, we needed to look outside the UAE.
Other international markets were growing too
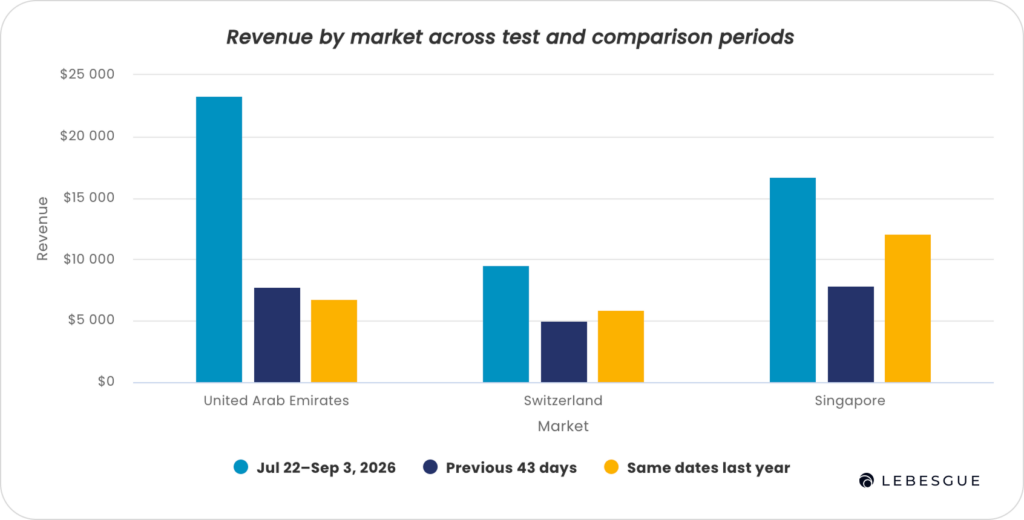
During the same period, Singapore and Switzerland also generated more revenue than they had during the previous period.
| Market | Test-period revenue | vs. previous period | First-time revenue share |
|---|---|---|---|
| UAE | $23,344 | +200.6% | 78.9% |
| Singapore | $16,735 | +112.3% | 64.1% |
| Switzerland | $9,554 | +90.8% | 53.5% |
The UAE clearly grew faster, but it wasn’t growing in isolation.
Singapore increased by 112.3%, while Switzerland increased by 90.8%, despite not receiving the same dedicated Meta campaign.
That tells us there was likely a broader business tailwind during the period.
Seasonality, promotions, existing brand demand, other marketing activity, or a combination of factors may have contributed to growth across markets.
If we simply compared UAE revenue before and after launching the campaigns, we risk giving Meta credit for revenue that may have happened anyway.
This is where the comparison markets become useful.
How much revenue was actually incremental?
We used Singapore and Switzerland to estimate a counterfactual for the UAE.
In simple terms, we asked:
If the UAE had followed a similar growth pattern to the comparison markets, how much revenue might it have generated without the dedicated Meta campaigns?
Using the previous 43 days as the baseline, the comparison markets grew by approximately 2.02x on average.
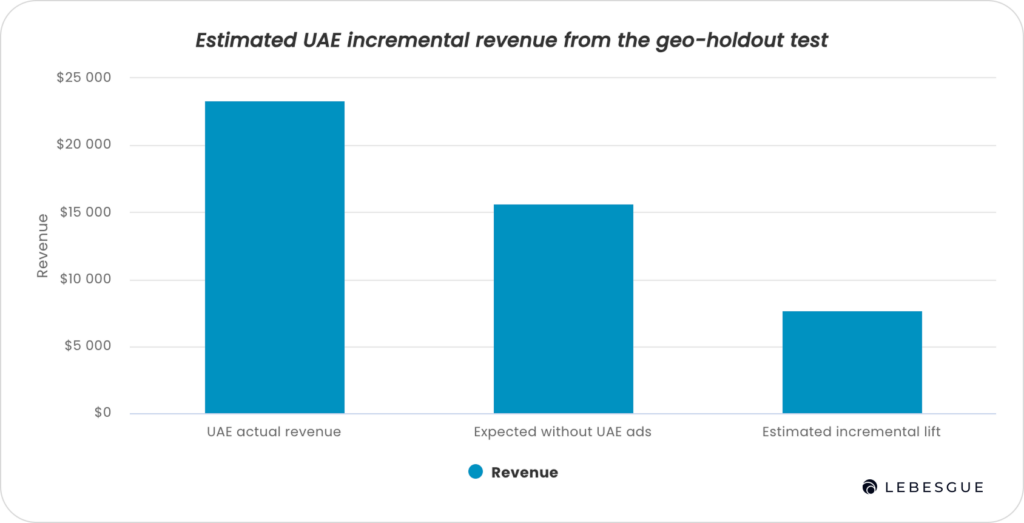
Applying the same growth rate to the UAE baseline gives us estimated revenue of approximately $15,651 without the dedicated campaigns.
Actual UAE revenue was $23,344.
| Measure | Revenue |
|---|---|
| Actual UAE revenue | $23,344 |
| Estimated revenue without dedicated Meta ads | $15,651 |
| Estimated incremental revenue | $7,693 |
This gives us a conservative estimate of approximately $7.7K in incremental revenue.
We also analyzed performance week by week using a difference-in-differences approach. That analysis produced an incremental revenue estimate of approximately $9.7K.
Rather than treating either calculation as an exact measure of Meta’s impact, we can use them as a practical range:
Approximately $7.7K to $9.7K in estimated incremental revenue.
That’s very different from saying Meta was responsible for the full $23,344 generated during the test.
And that’s precisely why incrementality is important.
The lift wasn't consistent every week
Looking only at the total test-period revenue also hides an important part of the story.
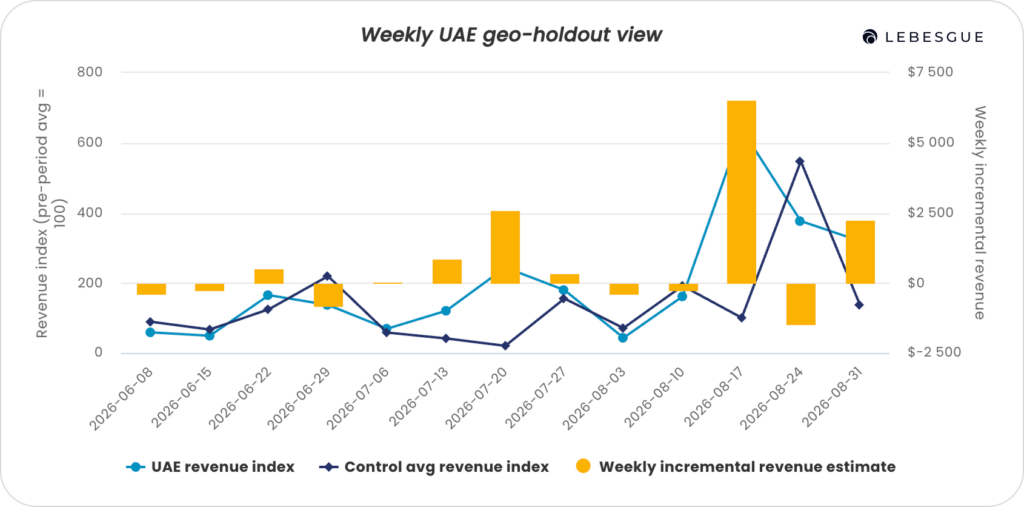
The UAE didn’t outperform the comparison markets every week.
It outperformed the control average in four of seven measured weeks and underperformed it in three.
The largest positive difference occurred during August 17–23, when UAE revenue increased significantly above the comparison-market average.
That week also coincided with a broader promotional period.
This suggests that the dedicated campaigns weren’t operating in isolation. The strongest performance was likely influenced by the combination of paid media and offer timing.
That doesn’t mean the ads weren’t incremental. It means the effect of advertising can depend on what else is happening in the business.
Paid media may amplify demand around an offer, expose the promotion to new customers, or capture customers who wouldn’t otherwise have discovered the brand.
It’s also one reason we wouldn’t interpret the $7.7K to $9.7K range as a precise causal measurement.
How did first-party attribution compare?
Once we had the geo-based estimates, we could compare them with another measurement approach.
We looked at revenue attributed to the UAE campaigns by Le Pixel, Lebesgue’s first-party attribution, across different attribution windows.
| Measurement method | Revenue |
|---|---|
| Conservative geo-holdout estimate | ~$7,693 |
| Weekly incrementality estimate | ~$9,711 |
| Le Pixel 1-day | $7,333 |
| Le Pixel 7-day | $9,947 |
| Le Pixel 14-day | $9,831 |
| Le Pixel 30-day | $9,493 |
This is where the experiment became particularly interesting.
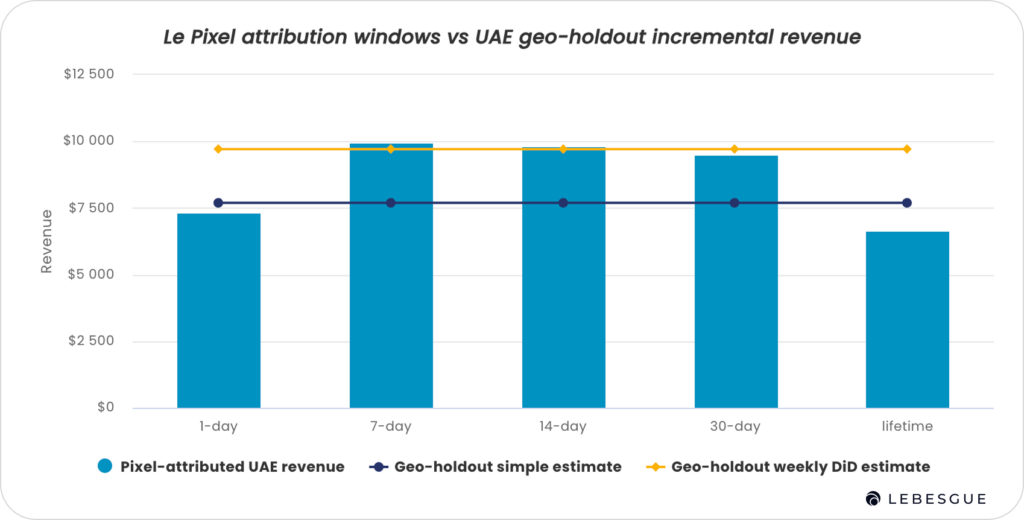
The 1-day Le Pixel attribution window came closest to the conservative geo-holdout estimate, reporting $7,333 in UAE Pixel-attributed revenue compared with approximately $7,693 in estimated incremental revenue. The gap was $360.
The 14-day attribution window came closest to the weekly difference-in-differences estimate, reporting $9,831 compared with approximately $9,711 in estimated incremental revenue. The gap was $120.
The 7-day and 30-day windows also landed in a similar range, reporting $9,947 and $9,493, respectively. The lifetime window was lower at $6,650, making it less aligned with either geo-based estimate.
This does not mean one model proves the other. Attribution and incrementality measure different things.
It does mean the two methods are not telling contradictory stories. A causal-style market comparison and a first-party attribution model are both pointing toward a similar conclusion: the UAE campaigns likely created meaningful incremental value.
For this test, the cleanest interpretation is:
| Reporting lens | Best-aligned read |
|---|---|
| Conservative incrementality read | Le Pixel 1-day |
| Central weekly incrementality read | Le Pixel 14-day |
| Practical working range | Le Pixel 7-day to 14-day |
That matters because attribution windows often create confusion instead of clarity. Here, they help narrow the story.
If the team wants a cautious read, the 1-day attribution window is the strongest match. If the goal is to mirror the weekly geo-holdout result more closely, the 14-day attribution window is the closest fit.
Does that mean attribution measures incrementality?
No, attribution and incrementality are not the same thing.
It’s important not to draw that conclusion from the experiment.
Attribution and incrementality measure different things.
An attribution model identifies which marketing interactions should receive credit for a conversion. A geo-holdout analysis attempts to estimate what would have happened if the advertising hadn’t occurred.
So the fact that Le Pixel’s attributed revenue was close to our geo-based estimates doesn’t prove that a particular attribution window is “correct.”
What it does tell us is that the two measurement approaches weren’t telling contradictory stories.
Our geo analysis estimated approximately $7.7K to $9.7K in incremental revenue.
Le Pixel reported:
- $7.3K with a 1-day window
- $9.9K with a 7-day window
- $9.8K with a 14-day window
- $9.5K with a 30-day window
When attribution and incrementality produce dramatically different results, that’s something worth investigating.
In this test, they landed in a similar range, giving us greater confidence in the broader conclusion that the UAE campaigns generated meaningful additional value.
What can we learn from the test?
The test highlighted an important point about measuring advertising performance: total revenue alone doesn’t tell you how much value your campaigns actually created.
To understand Meta’s contribution, we had to look beyond overall growth and separate new customer revenue, compare performance with markets that weren’t receiving the same investment, and use multiple measurement approaches to understand the result.
Three key takeaways stood out:
- Revenue growth doesn’t automatically equal advertising impact. A business can grow for many reasons, so not every additional dollar of revenue should be credited to paid media.
- First-time customer revenue adds important context. Looking at how much revenue came from new customers helped us understand whether the campaigns were reaching new demand rather than primarily capturing existing customers.
- No single measurement tells the whole story. Comparing total revenue, geo-based incrementality, and first-party attribution gave us a more complete view of campaign performance than any one metric could provide on its own.
Revenue growth doesn't automatically equal advertising impact
The UAE grew by more than 200%, but Singapore and Switzerland were growing too.
Looking only at UAE revenue before and after launching the campaign would have made Meta’s contribution appear much larger.
Comparison markets gave us important context for separating overall business growth from the additional growth associated with the campaign.
First-time customer revenue provides another important signal
Nearly 79% of UAE revenue came from first-time customers during the experiment.
For acquisition campaigns, that’s an important distinction.
A market generating more revenue from existing customers tells a different story from one in which the majority of revenue comes from people purchasing from the brand for the first time.
Attribution and incrementality answer different questions
Neither measurement approach needs to replace the other.
Attribution helps us understand which marketing interactions contributed to conversions.
Incrementality helps us estimate whether advertising created results beyond what likely would have happened anyway.
Looking at both can provide more context than relying on a single ROAS number.
Attribution windows can materially change the result
Depending on the Le Pixel attribution window, attributed UAE campaign revenue ranged from approximately $7.3K to $9.9K across the primary windows we analyzed.
That’s a meaningful difference.
It also shows why choosing an attribution window simply because it produces the highest reported ROAS isn’t a particularly useful measurement strategy.
What this can tell US ecommerce brands testing international markets
This experiment was designed to measure the incremental impact of the UAE campaigns, not to test international shipping itself.
But the findings have an interesting application for US ecommerce brands that already sell globally and are considering investing more heavily in particular international markets.
International orders can tell you that demand exists. They don’t necessarily tell you what happens when you actively invest in acquiring more customers in that market.
A targeted paid-media test can provide another layer of evidence.
Instead of evaluating a new market only by asking whether revenue increased, brands can look at:
- how the market performs relative to its historical baseline
- whether it grows faster than comparable markets
- how much revenue comes from first-time customers
- whether the additional revenue appears incremental
- whether performance remains strong enough to justify further investment
The UAE produced encouraging signals across several of those areas.
Revenue increased significantly. Nearly 79% came from first-time customers. The UAE grew faster than Singapore and Switzerland. And after accounting for broader growth across the business, the geo analysis still showed an estimated $7.7K to $9.7K in incremental revenue.
This doesn’t tell us that the UAE will be the right expansion market for every US ecommerce store.
Instead, it shows how brands that already have the operational ability to serve international customers can test demand before making a larger investment in a market.
International expansion doesn’t have to be evaluated only by looking at total sales from a country. Paid acquisition experiments, combined with comparison markets and first-party data, can help determine whether increasing investment is actually bringing new customers and additional revenue.
Limitations of the experiment
This wasn’t a perfect scientific holdout.
Singapore and Switzerland were useful comparison markets, but they weren’t randomized controls. Markets can behave differently because of seasonality, customer behavior, competition, brand awareness, promotions, and many other factors.
The test period was also relatively short, and one of the strongest UAE weeks coincided with a promotional period.
For those reasons, we wouldn’t claim that Meta definitively generated exactly $7,693 or $9,711 in incremental revenue.
The more defensible conclusion is that the evidence points toward meaningful incremental lift, with the different approaches placing that lift within a similar range.
A longer experiment with cleaner separation from promotional periods and additional comparison markets could help narrow the estimate further.
Summing Up
The UAE test showed strong growth, with revenue increasing from $7,766 to $23,344 and nearly 79% of test-period revenue coming from first-time customers.
But the 200% increase didn’t mean Meta created all of that growth. After accounting for performance in the comparison markets, our analysis estimated approximately $7.7K to $9.7K in incremental revenue. Le Pixel attribution landed in a similar range, providing another perspective on the campaigns’ contribution.
For US ecommerce brands investing in international markets, the takeaway is to look beyond whether sales are growing. The more important question is how much additional revenue your marketing investment is actually creating.
Frequently Asked Questions about Meta Ads Incrementality
Meta Ads incrementality refers to revenue, orders, or customers that likely would not have occurred without the advertising. Instead of asking which conversions Meta should receive credit for, incrementality asks what additional results the advertising actually created.
A geo-holdout test compares a geographic market receiving a specific marketing treatment with markets that don’t receive the same treatment. Their performance can be used to estimate what may have happened in the treatment market without the additional advertising.
Attribution determines which marketing interactions receive credit for a conversion. Incrementality attempts to estimate whether the conversion would have happened without the marketing activity. They answer related but different questions.
For ecommerce brands already able to serve international customers, targeted paid acquisition can provide a way to learn more about demand in a particular market. Results should be evaluated beyond revenue and ROAS by considering new customer acquisition, historical performance, comparable markets, and incremental lift.
Useful metrics include total revenue, first-time customer revenue, new customer orders, customer acquisition cost, performance relative to the market’s historical baseline, performance relative to comparable markets, and estimated incremental revenue.
Our conservative geo-holdout analysis estimated approximately $7.7K in incremental revenue, while the weekly difference-in-differences analysis estimated approximately $9.7K. Because the experiment used real-world comparison markets rather than randomized controls, we consider the range more useful than claiming one exact number.
The 1-day attribution window was closest to the conservative geo estimate, while the 14-day window was closest to the weekly incrementality estimate. The 7-day and 30-day windows also landed within a similar range.
No. Attribution and incrementality measure different things, so similar results don’t prove that an attribution model measures causal impact. In this experiment, however, the fact that several approaches produced similar estimates gave us more confidence in the overall interpretation of the campaign’s impact.