
Where your store sits in the market
Trusted by 10,000+ eCommerce brands worldwide.
Every part of your funnel, benchmarked
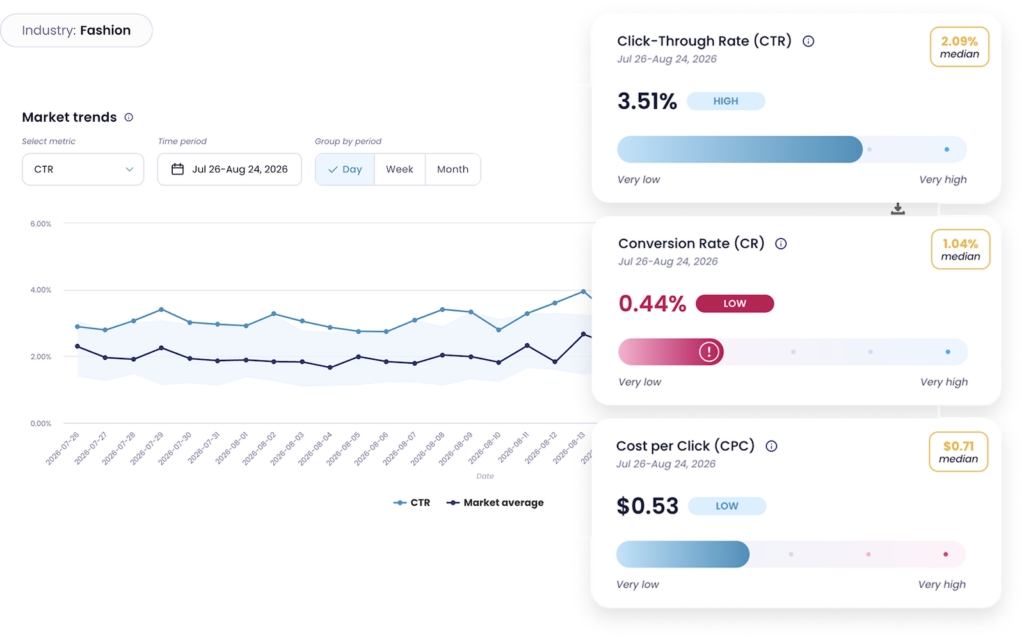
Market Benchmarks brings Meta Ads, Google Ads, and store-wide ecommerce metrics into one comparison, so you're not reading platform numbers in isolation.

Meta Ads Benchmarks
CTR · CPC · CPM · ROAS · Add-to-Cart · Initiate-Checkout
See whether your Meta Ads performance is above or below the market, and where in the funnel the gap is coming from.

Google Ads Benchmarks
CTR · CPC · CPM · CAC · ROAS ·
By campaign type
Compare performance across Google campaign types to see exactly where the gap to your peers is coming from.

Ecommerce Benchmarks
Understand what happens after the click: retention, order value, and customer lifetime value, store-wide.
Your numbers show what happened. Benchmarks show what it means relative to the market.
See the full distribution, not one number
Your current value, side by side with the peer median
No digging through separate reports to compare the two.
Your relative position in the market
Very low, low, average, high, or very high — in plain language.
25th, 50th, and 75th percentile range
The real spread of your peer group, not a flattened average.
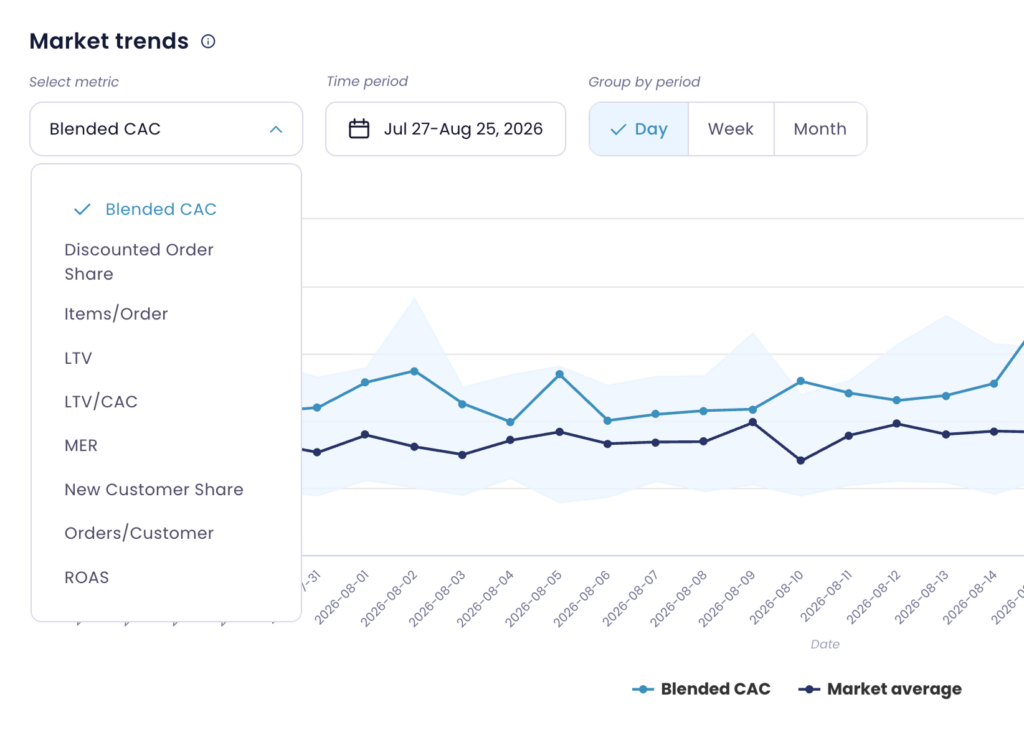
How your position is trending over time
Know if you're pulling ahead of the market or falling behind it.
"Good" depends on industry and AOV
A $30 candle brand and a $300 skincare set don't run on the same numbers. Below is the same metric shown for two different peer groups — the "good" range shifts each time.
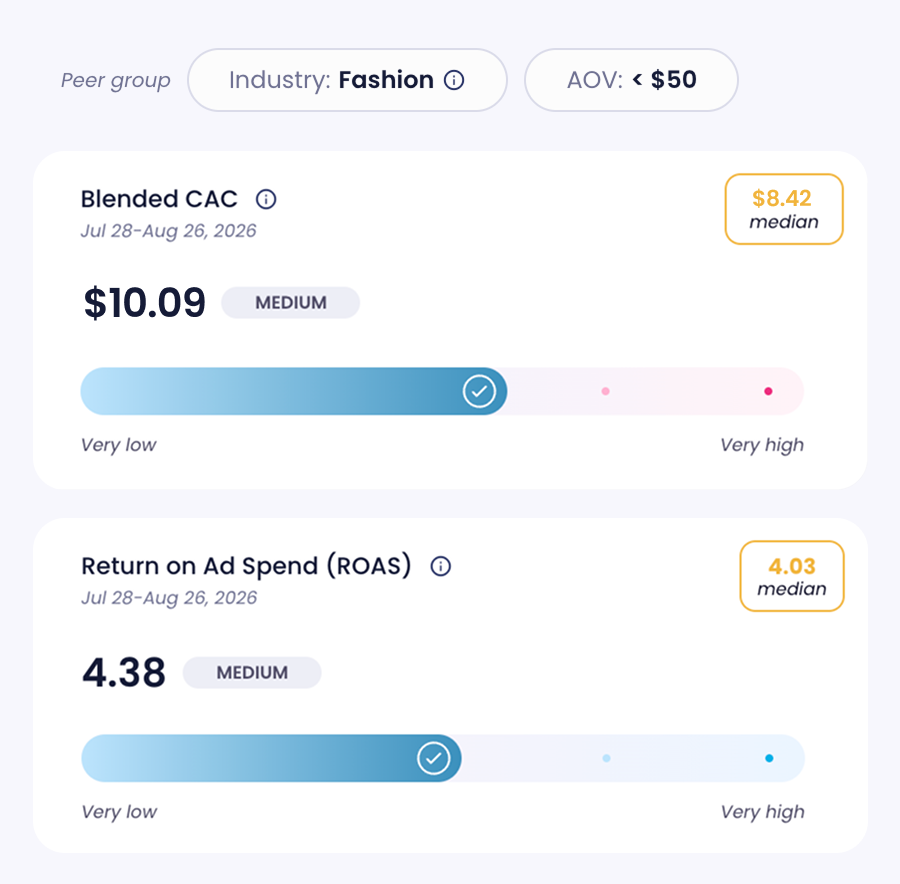
ROAS — Fashion, <$50 AOV
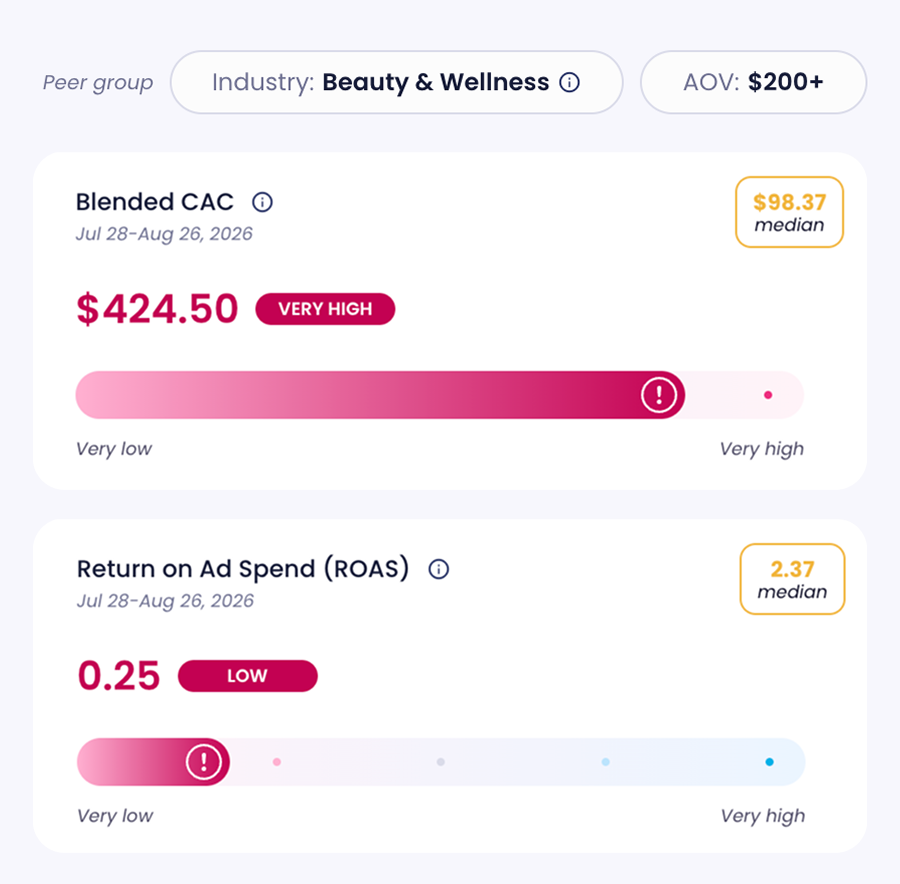
ROAS — Beauty & Wellness, $200+ AOV
What this means for your target
How Lebesgue builds your peer group
1
Group by industry & AOV
2
Compare against the distribution
3
Recalculate as the market moves
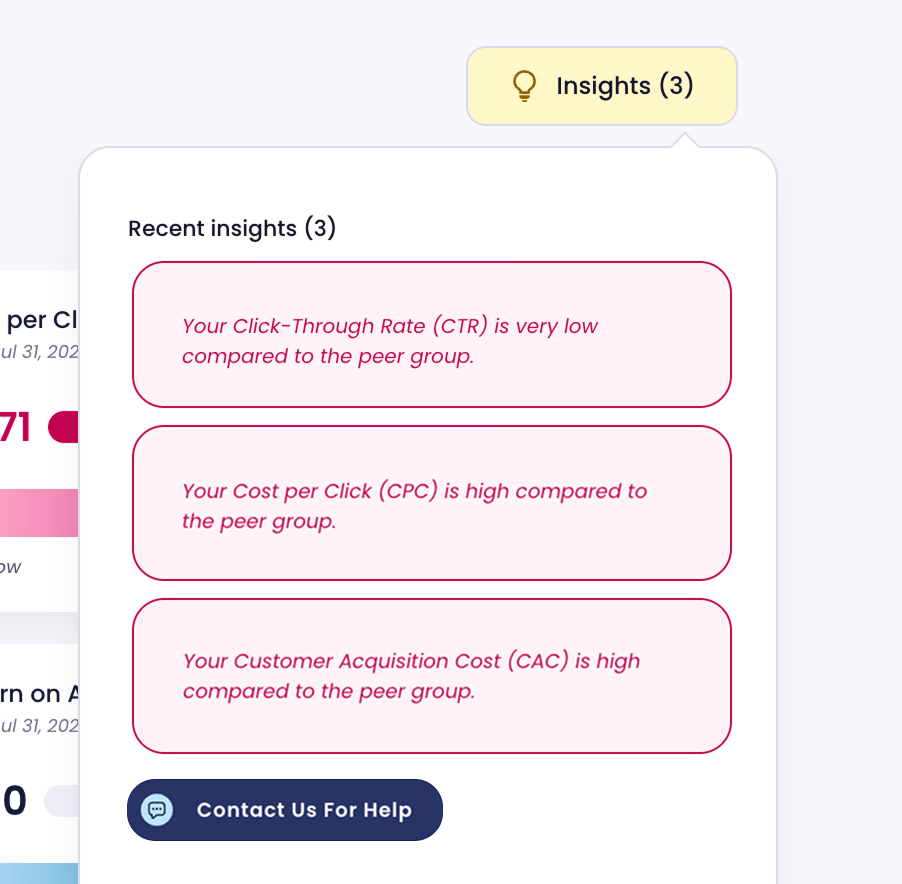
Strong on one platform can still mean weak overall
Meta Ads ROAS looks strong.
Google conversion rate is above market.
Acquisition costs are competitive.
10,000+
businesses using Lebesgue: AI CMO
Frequently Asked Questions about Meta, Google Ads and Ecommerce Benchmarks
Ecommerce benchmarks compare your store’s performance metrics with results from other ecommerce stores. Lebesgue makes these comparisons more relevant by benchmarking your store against a peer group based on industry and average order value.
Blended CAC, discounted order share, items per order, LTV, LTV/CAC ratio, marketing efficiency ratio (MER), new customer share, orders per customer, and ROAS.
CTR, conversion rate, CPC, CPM, CAC, ROAS, add-to-cart rate, and initiate-checkout rate.
CTR, conversion rate, CPC, CPM, CAC, and ROAS — broken down by campaign type so you can see where performance differs.
Your store is assigned to a peer group based on industry and average order value, then compared with stores in that same cluster and AOV range — not one generic ecommerce average.
Lebesgue uses your current store and advertising data whenever you view Market Benchmarks, while the underlying peer distributions are regularly recalculated.