Getting your Facebook ads up and running requires choosing the perfect creative type for your ads. But this can be a challenge if you’re not familiar with each creative type. Within this blog post, we’ll break down the details of every Facebook ads creative type available and show you how they perform.
So, let’s dive in!
Facebook Ads Creative Type
Facebook’s creative types refer to different formats and styles of ads you can create and use on the platform. These creative types are designed to help advertisers effectively engage their target audience and achieve their marketing goals.
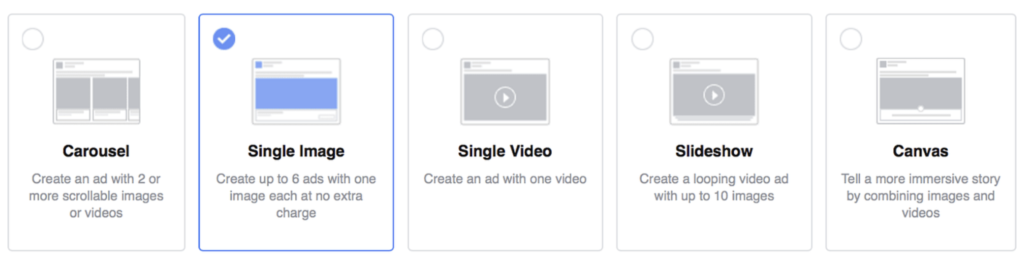
Some common Facebook creative types are Image ads, Video ads, Carousel ads, and Dynamic ads. Each creative type has a different value. To choose the right type for your ads, let’s explore the main differences between them.
Creative Type / Feature
Image ads
Video ads
Carousel Ads
Dynamic ads
Description
Single image with text and link
Single video or multiple videos in a series
Multiple images or videos in a single ad
Automatically promote relevant products
Engagement Type
Visual impact with a single image
Engaging storytelling through video
Interactive browsing through multiple cards
Personalized and targeted based on user behavior
Ideal Use Case
Simple messages, brand awareness
Demonstrations, storytelling, engagement
Showcasing multiple products or features
E-commerce, product catalog promotion
Supported Media
JPEG, PNG
MP4, MOV, GIF
JPEG, PNG, MP4, MOV, GIF
Automatically generated from the product catalog
Ad Placement
News Feed, Right Column, Instagram
News Feed, Stories, Right Column, Instagram
News Feed, Stories, Instagram
News Feed, Right Column, Instagram
User Interaction
Single click
Play, pause, click
Swipe through cards, click
Click based on personalized product suggestions
Setup Complexity
Simple to create and set up
Requires video production
Moderate; requires multiple assets
Complex; requires integration with product catalog
As we mentioned before, each ad type has its own strengths and ideal use cases, so the choice depends on your campaign goals, budget, and target audience.
The Average Usage of the Creative Types
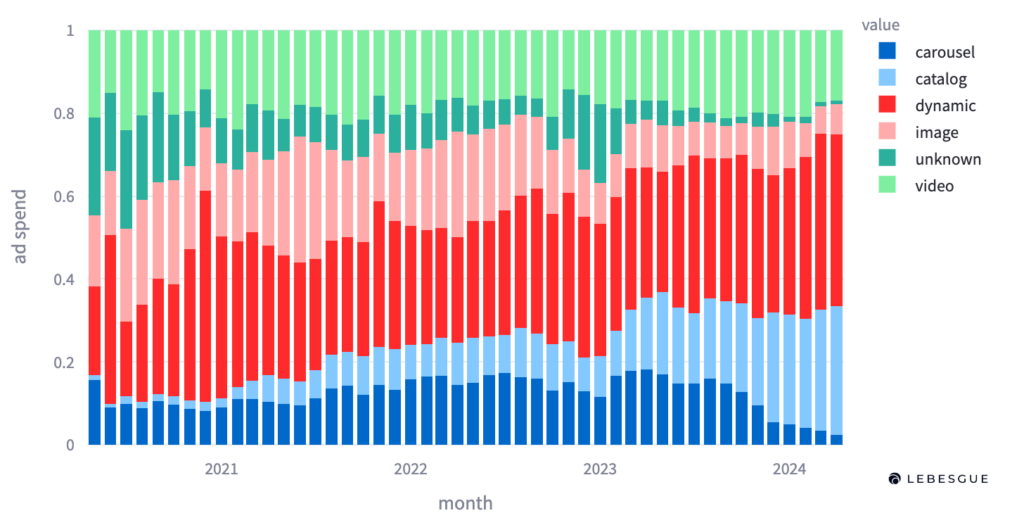
Based on the analysis of $18.60 million in ad spend, the breakdown of creative types shows that dynamic ads are the most used, accounting for 41.1% of the total spend.
Catalog ads follow with 28.8%, while video ads make up 18.3%, image ads 7.43%, and carousel ads 3.31%. In 2024, there has been a noticeable increase in the usage of both catalog ads and dynamic ads, reflecting a trend towards more personalized and targeted advertising approaches. On the other hand, the usage of video ads, image ads, and carousel ads has declined, indicating a shift away from these formats among advertisers.
This change suggests that marketers are increasingly prioritizing ads that can dynamically adapt to individual user preferences and showcase a range of products effectively.
Facebook Ads Creatives Benchmarks
Facebook ads creatives benchmarks are performance metrics used to evaluate the effectiveness of ad creatives on the platform. These benchmarks help advertisers understand how well their images, videos, carousels, and other ad formats are performing.
Without further ado let’s see Facebook ads creatives benchmarks.
Facebook ads creatives CPM benchmarks
CPM metrics are crucial for understanding the cost efficiency of your Facebook ad campaigns, as they indicate how much you are spending to reach a thousand impressions.
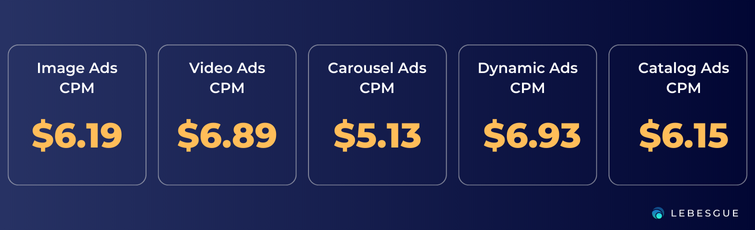
Among the various ad formats, carousel ads have the lowest median CPM at approximately $5.13. This makes them a cost-effective choice for advertisers looking to engage users with multiple images or videos in a single ad unit.
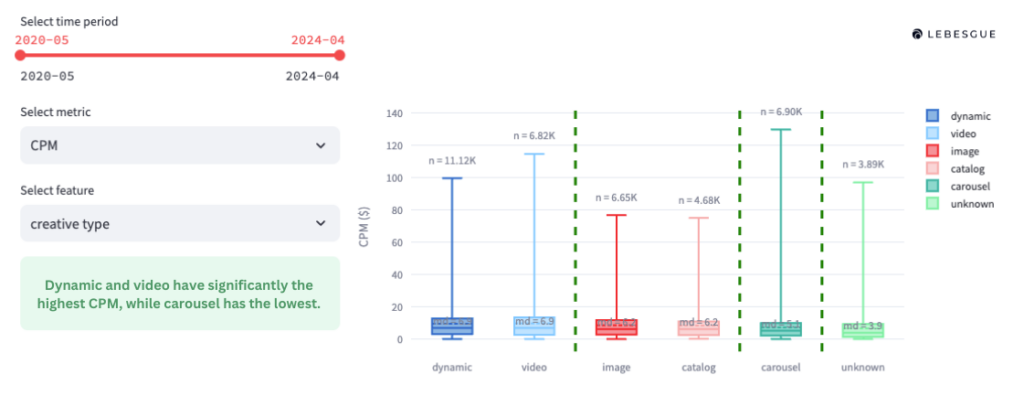
Image and catalog ads have slightly higher median CPMs, both just over $6. These ad types still offer a reasonable cost per impression, making them a good option for campaigns focused on visual appeal and product listings.
However, the highest median CPMs are seen with video and dynamic ads, each around $6.90.
Facebook ads creatives CR benchmarks
Conversion Rate metrics are essential for understanding how effectively your Facebook ads drive desired actions (purchase).
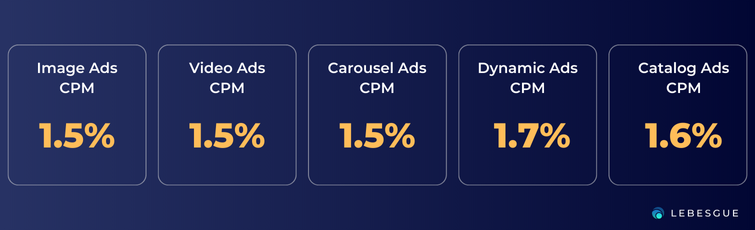
Among different ad formats, image, video, and carousel ads share a median CR of 1.5%. This indicates a consistent performance across these formats in terms of converting impressions into actions.
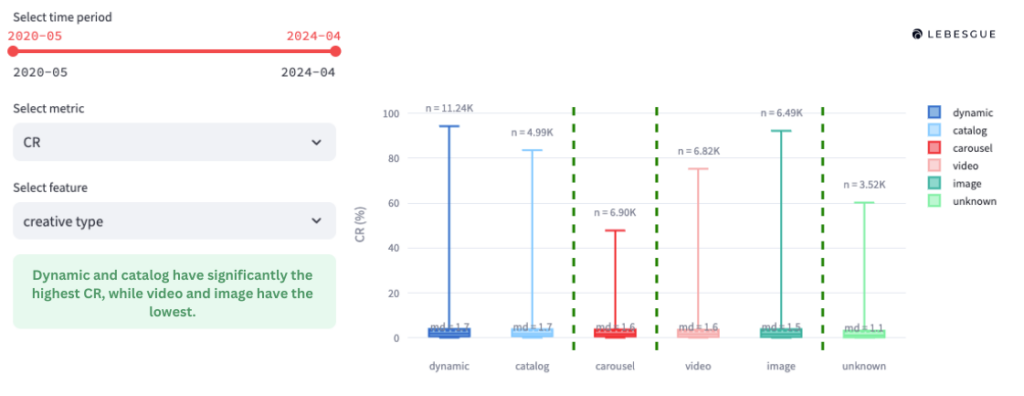
Catalog ads have a slightly higher median CR of 1.6%, suggesting they are more effective at driving conversions, likely due to their ability to showcase multiple products in a structured and appealing manner.
Dynamic ads top the chart with a median CR of 1.7%, highlighting their superior performance in personalizing content to individual users’ preferences and behaviors. This higher conversion rate makes dynamic ads particularly valuable for campaigns focused on achieving high conversion.
Facebook ads creatives CTR benchmarks
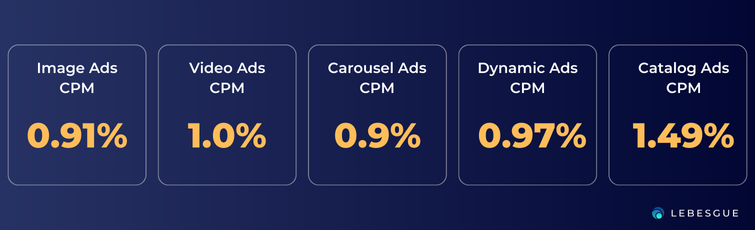
Click-through rate metrics are vital for assessing how effectively your Facebook ads generate interest and drive traffic by prompting users to click. Image ads have a median CTR of 0.91%, indicating a decent level of engagement for visual content.
Video ads perform slightly better with a median CTR of 1.0%, reflecting their ability to captivate and engage users more effectively through dynamic content.
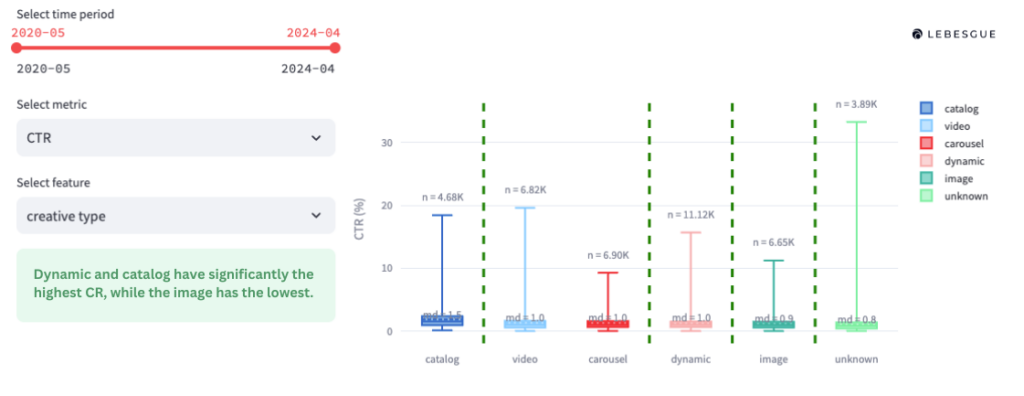
Carousel ads have a median CTR of 0.9%, showing that while they offer the opportunity to showcase multiple products or features, their engagement rate is comparable to that of single image ads.
Dynamic ads have a median CTR of 0.97%, demonstrating their effectiveness in providing personalized content that resonates with users. Catalog ads stand out with the highest median CTR of 1.49%, underscoring their strong performance in attracting clicks by presenting a range of relevant products to the audience.
This makes catalog ads particularly effective for campaigns aiming to drive high levels of user interaction and traffic.
Facebook ads creatives CAC benchmarks
With Customer Acquisition Cost (CAC) metrics, you can understand the cost efficiency of different Facebook ad formats in acquiring new customers.
Image ads have a median CAC of $25.8, indicating a relatively high cost to acquire a new customer through visual content. Video ads are slightly more cost-effective, with a median CAC of $25.4, suggesting that dynamic video content can engage users at a marginally lower acquisition cost.
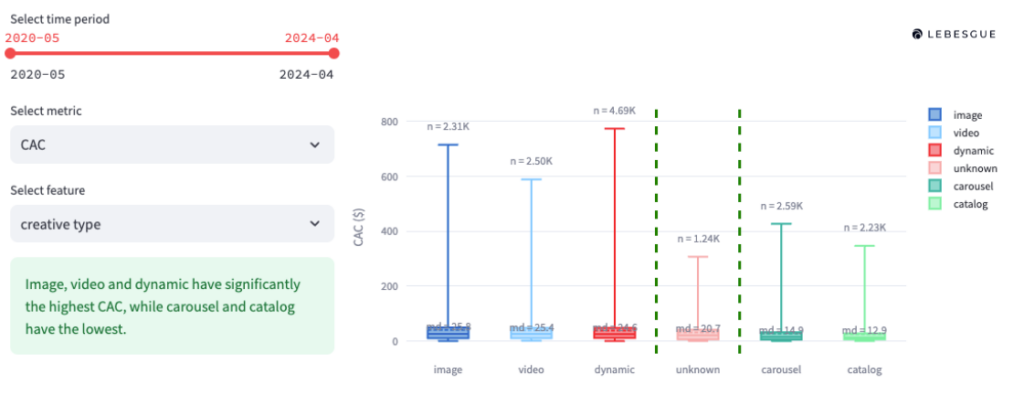
Carousel ads significantly lower the cost, with a median CAC of $14.8. This indicates that the interactive nature of carousel ads, allowing users to swipe through multiple images or videos, is more effective in converting users at a reduced cost.
Dynamic ads have a median CAC of $24.6, which, while higher than carousel ads, still offers a cost-efficient means of acquiring customers through personalized and targeted content.
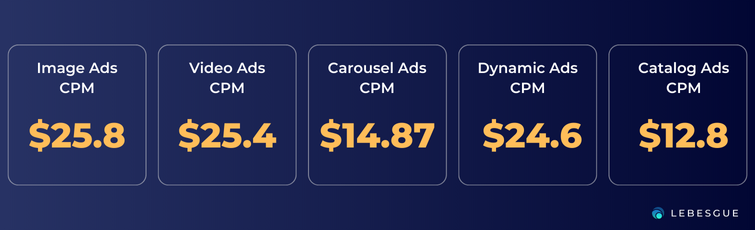
Catalog ads boast the lowest median CAC at $12.86, highlighting their superior cost efficiency in acquiring new customers. This efficiency is likely due to their ability to showcase a range of relevant products to users, increasing the likelihood of conversion at a lower cost.
Consequently, catalog ads are particularly valuable for advertisers aiming to minimize their customer acquisition costs while maximizing conversions.
Facebook ads creatives ROAS benchmarks
Return on Ad Spend (ROAS) metrics are essential for evaluating the revenue generated for every dollar spent on advertising, providing insights into the overall effectiveness and profitability of different Facebook ad formats.
Image ads have a median ROAS of 155%, indicating that for every dollar spent, they generate $1.55 in revenue, showcasing a solid return on investment for visual content.
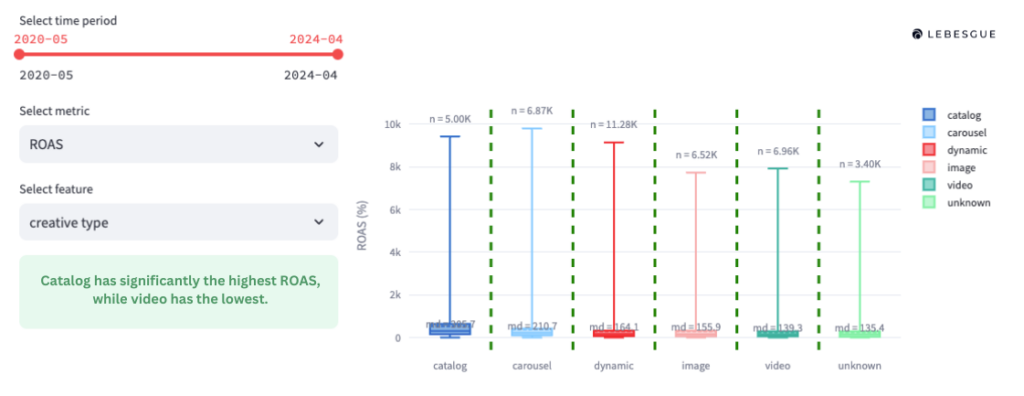
Video ads have a slightly lower median ROAS of 139%, translating to $1.39 in revenue for every dollar spent. This suggests that while video content can be engaging, it might not always lead to the highest revenue returns.
Carousel ads perform significantly better, with a median ROAS of 210%, meaning they generate $2.10 in revenue for every dollar spent. This highlights the effectiveness of carousel ads in driving higher returns through their interactive and multi-product format.
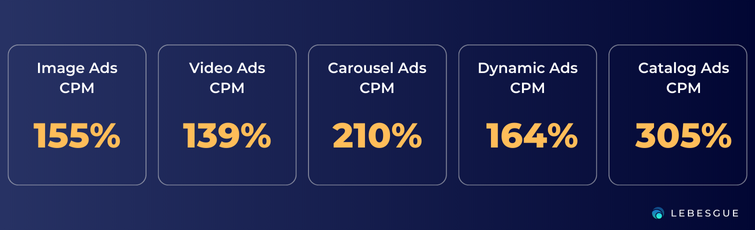
Dynamic ads have a median ROAS of 164%, indicating they generate $1.64 in revenue for every dollar spent. Their personalized content approach proves to be effective in driving a good return on investment. Catalog ads stand out with the highest median ROAS of 305%, generating $3.05 in revenue for every dollar spent.
This performance underscores the efficiency of catalog ads in showcasing a wide range of relevant products, making them highly profitable and valuable for advertisers aiming to maximize their revenue.
Best Practices for Ads Creative
When aiming to maximize return on investment (ROI), prioritize catalog ads. With a median return of $3.05 for every dollar spent (305% ROAS) and a low customer acquisition cost (CAC) of $12.86, catalog ads are highly cost-effective, especially for e-commerce businesses. They allow you to showcase a wide range of products effectively.
For effective audience engagement, consider using carousel ads. These ads have a median ROAS of $2.10 (210%) and a CAC of $14.8. Carousel ads enable you to display multiple images or videos in one ad, making them great for storytelling and showcasing a variety of products or features.
Dynamic ads strike a balance between cost and performance, with a median ROAS of $1.64 (164%) and a CAC of $24.6. These ads are personalized based on user behavior, making them effective for retargeting campaigns. Use dynamic ads to deliver tailored content that resonates with individual preferences.
While video ads have a lower median ROAS of $1.39 (139%) and a higher CAC of $25.4, they are valuable for building brand awareness and engagement. Use video ads when storytelling and dynamic content are crucial to your campaign goals. Ensure your videos are compelling to justify the higher costs.
Image ads offer a straightforward approach with a median ROAS of $1.55 (155%) and a CAC of $25.8. Use them for clear and visually appealing messages, particularly when budget considerations are important. High-quality visuals are key to maximizing their impact.
By following these strategies, you can align your ad strategies with the formats that offer the best returns and efficiencies based on the provided benchmarks.
Summing Up
And there you have it – the latest Facebook Ads benchmarks for Facebook ads creative types. We hope this info helps you understand better and encourages you to use these ideas in your ads.
If you’re looking for more insights, check out our tips on how to audit your Facebook ads for even better results.