How do you know if your Meta Ads performance is actually good?
Your own account can tell you whether CAC increased this month, whether ROAS improved, or whether more people are clicking your ads. What it cannot tell you on its own is how those results compare with other ecommerce businesses.
And that comparison changes depending on the business. A store with an average order value below $50 is working with very different acquisition costs and conversion rates than a store where customers spend more than $200 per order. Industry creates another difference, which means that even stores within the same AOV range can have very different Meta Ads benchmarks.
To provide a more relevant comparison, we analyzed Meta Ads performance across eight ecommerce industries and four average order value (AOV) ranges. The data covers the full path from showing an ad to acquiring a customer, including:
- Customer acquisition cost (CAC)
- Return on ad spend (ROAS)
- Cost per click (CPC)
- Cost per thousand impressions (CPM)
- Click-through rate (CTR)
- Conversion rate (CR)
- Add-to-cart rate (ATCR)
- Initiated checkout rate (ICR)
About the data: The benchmarks in this blog post represent median performance across ecommerce businesses in the Lebesgue benchmark dataset. Businesses are grouped into eight industry categories and four AOV ranges: under $50, $50–$100, $100–$200, and $200+. The median is used to provide a representative benchmark without results being overly influenced by unusually high or low values.
What Are Meta Ads Benchmarks?
Meta Ads benchmarks give you a reference point for understanding your advertising results. Instead of looking at your CAC, ROAS, or CTR in isolation, you can compare those results with what similar ecommerce businesses are achieving.
There is no single Meta Ads benchmark that applies to every store. Performance varies across industries and AOV ranges, so a benchmark gives you additional context for understanding whether your results are strong or whether there may be room for improvement.
How Industry and AOV Change Meta Ads Benchmarks
Meta Ads benchmarks can vary significantly depending on what a business sells and how much customers typically spend per order. This is why industry and average order value are important when deciding which businesses provide a relevant comparison for your own performance.
AOV is particularly visible in metrics such as CAC and conversion rate. Across many industries in our data, businesses with a higher AOV have a higher CAC and a lower conversion rate. In Fashion, for example, CAC increases from $15.37 below $50 AOV to $75.50 above $200, while conversion rate decreases from 2.18% to 1.06% across the same AOV ranges.
Industry adds another level of variation because businesses with a similar AOV can still have very different benchmarks. Among businesses with a $100–$200 AOV, for example, ROAS ranges from 1.82x for Food, Beverage & Pet to 4.17x for Home & Lifestyle.
As a result, a CAC, ROAS, or conversion rate that looks high or low compared with a general Meta Ads benchmark may be much closer to the typical result for your specific industry and AOV range. Using both gives you a more relevant baseline for evaluating your Meta Ads performance.
Explore Meta Ads Benchmarks
Choose a metric and AOV range to compare Meta Ads benchmarks across ecommerce industries.
Source: Lebesgue Meta Ads Benchmarks
Meta Ads CAC Benchmarks
Customer acquisition cost (CAC) measures how much you spend on Meta Ads to acquire a new customer. It connects your advertising spend directly with customer acquisition, making it one of the most useful metrics for understanding whether the amount you are spending to bring in new customers is in line with similar businesses.
What is a good CAC for Meta Ads?
Our benchmarks show that CAC generally increases as AOV increases, although the size of the difference varies across industries.
Fashion shows this clearly, with CAC increasing from $15.37 for businesses with an AOV below $50 to $75.50 for businesses with an AOV above $200.
This difference is important when evaluating your own acquisition costs. A $30 CAC, for example, would be almost twice the Fashion benchmark below $50 AOV, while it would be well below the benchmark for Fashion businesses above $200 AOV.
When comparing your CAC, use the industry and AOV range closest to your business to understand how your acquisition costs compare with the market.
Meta Ads CAC benchmarks by industry and AOV
| Industry | Under $50 | $50–$100 | $100–$200 | $200+ |
|---|---|---|---|---|
| Beauty & Wellness | $20.31 | $31.19 | $38.64 | $64.33 |
| Electronics & Gaming | $15.71 | $17.56 | $32.57 | $60.28 |
| Fashion | $15.37 | $18.60 | $30.96 | $75.50 |
| Fitness & Outdoors | $16.02 | $25.22 | $32.68 | $67.04 |
| Food, Beverage & Pet | $16.99 | $17.87 | $44.86 | $60.28 |
| Home & Lifestyle | $15.03 | $17.75 | $20.55 | $45.64 |
| Jewellery & Accessories | $16.02 | $20.95 | $32.56 | $72.27 |
| Services & Other | $16.13 | $22.77 | $28.05 | $54.93 |
CAC tells you how expensive it is to acquire a customer, but it does not tell you how much revenue that advertising spend generates. For that, the next benchmark to look at is ROAS.
Meta Ads ROAS Benchmarks
Return on ad spend (ROAS) compares the revenue attributed to your Meta Ads with the amount you spent on those ads. A 3x ROAS, for example, means that $3 in revenue was attributed to Meta for every $1 spent.
Because ROAS connects spend with revenue, it provides another side of the acquisition picture. CAC tells you what it costs to acquire a customer, while ROAS shows how much revenue your advertising spend generates.
What is a good ROAS for Meta Ads?
There is no single ROAS benchmark that applies to every ecommerce business. Our data shows that ROAS varies across both industries and AOV ranges, so the most useful comparison is with businesses similar to yours.
For example, among businesses with a $100–$200 AOV, ROAS ranges from 1.82x for Food, Beverage & Pet to 4.17x for Home & Lifestyle. This means that the same ROAS can represent very different performance depending on the industry.
A 3x ROAS, for example, would be above the benchmark for Food, Beverage & Pet in this AOV range, but below the benchmark for Home & Lifestyle.
When evaluating your ROAS, start with the benchmark for your industry and AOV range, and then look at it alongside CAC to get a better understanding of your acquisition performance.
Meta Ads ROAS benchmarks by industry and AOV
| Industry | Under $50 | $50–$100 | $100–$200 | $200+ |
|---|---|---|---|---|
| Beauty & Wellness | 1.78x | 1.67x | 2.44x | 1.63x |
| Electronics & Gaming | 1.98x | 2.67x | 3.25x | 2.76x |
| Fashion | 2.20x | 3.48x | 3.63x | 2.68x |
| Fitness & Outdoors | 1.88x | 2.60x | 3.12x | 3.17x |
| Food, Beverage & Pet | 2.00x | 2.95x | 1.82x | 2.76x |
| Home & Lifestyle | 2.06x | 2.91x | 4.17x | 4.58x |
| Jewellery & Accessories | 1.88x | 2.82x | 3.49x | 1.83x |
| Services & Other | 1.59x | 2.56x | 3.92x | 2.86x |
When CAC or ROAS differs from your benchmark, looking earlier in the advertising funnel can help you understand where that difference begins. CPC is one of the first metrics to check because it shows how much you are paying to bring potential customers to your store.
Meta Ads CPC Benchmarks
Cost per click (CPC) measures the average amount you pay when someone clicks your Meta ad. Together with CTR, it helps you understand how efficiently your impressions are turning into website traffic before you start looking at what those visitors do after the click.
What is a good CPC for Meta Ads?
CPC can vary significantly between industries, even for businesses within the same AOV range.
For example, among businesses with a $50–$100 AOV, CPC ranges from $0.36 for Jewellery & Accessories to $1.03 for Beauty & Wellness. This shows how different the cost of generating a click can be for businesses selling at a similar order value.
When evaluating CPC, it is also important to look at what happens after the click. A higher CPC can still lead to strong overall performance if that traffic converts efficiently and results in a competitive CAC and ROAS.
Meta Ads CPC benchmarks by industry and AOV
| Industry | Under $50 | $50–$100 | $100–$200 | $200+ |
|---|---|---|---|---|
| Beauty & Wellness | $0.65 | $1.03 | $0.94 | $1.40 |
| Electronics & Gaming | $0.49 | $0.42 | $0.63 | $0.78 |
| Fashion | $0.48 | $0.38 | $0.50 | $0.84 |
| Fitness & Outdoors | $0.53 | $0.63 | $0.63 | $1.11 |
| Food, Beverage & Pet | $0.67 | $0.71 | $0.84 | $0.78 |
| Home & Lifestyle | $0.51 | $0.44 | $0.61 | $0.61 |
| Jewellery & Accessories | $0.53 | $0.36 | $0.68 | $1.16 |
| Services & Other | $0.61 | $0.61 | $0.60 | $0.47 |
CPC tells you what you pay once someone clicks, while CPM moves one step earlier and shows how much it costs to generate the impressions those clicks come from.
Meta Ads CPM Benchmarks
Cost per thousand impressions (CPM) measures how much you pay for every 1,000 Meta ad impressions. Since impressions come before clicks, CPM provides useful context for understanding whether higher traffic costs begin with the cost of reaching your audience or later in the funnel.
What is a good CPM for Meta Ads?
CPM tends to be higher for businesses with a higher AOV, but the results also vary by industry.
For example, Fashion has a CPM of $6.67 for businesses with an AOV below $50, compared with $15.24 for businesses with an AOV above $200.
The differences between industries become especially clear in the $200+ AOV range, where CPM ranges from $9.95 for Services & Other to $21.67 for Jewellery & Accessories.
When comparing your CPM with the benchmark, look at CTR and CPC as well. A higher CPM does not always result in a higher cost per click if your ads are generating clicks efficiently.
Meta Ads CPM benchmarks by industry and AOV
| Industry | Under $50 | $50–$100 | $100–$200 | $200+ |
|---|---|---|---|---|
| Beauty & Wellness | $8.10 | $14.35 | $12.06 | $15.93 |
| Electronics & Gaming | $6.69 | $9.33 | $11.38 | $13.80 |
| Fashion | $6.67 | $8.64 | $12.33 | $15.24 |
| Fitness & Outdoors | $7.35 | $9.05 | $11.64 | $12.54 |
| Food, Beverage & Pet | $7.95 | $9.60 | $11.69 | $13.80 |
| Home & Lifestyle | $9.16 | $10.41 | $10.77 | $11.52 |
| Jewellery & Accessories | $7.35 | $6.33 | $12.29 | $21.67 |
| Services & Other | $9.60 | $9.66 | $9.30 | $9.95 |
The connection between CPM and CPC becomes easier to understand when CTR is added to the comparison, because CTR shows how many of those impressions are actually becoming clicks.
Meta Ads CTR Benchmarks
Click-through rate (CTR) measures the percentage of ad impressions that result in a click. It helps you understand how often people who see your Meta ads take the next step and visit your store.
A higher CTR can help turn the same number of impressions into more traffic, but CTR alone does not show whether that traffic eventually converts. It is therefore most useful as part of the wider path from impression to purchase.
What is a good CTR for Meta Ads?
A good CTR can look quite different depending on the industry. For businesses with a $100–$200 AOV, the benchmark ranges from 1.21% for Food, Beverage & Pet to 2.46% for Fashion.
That is a meaningful difference for businesses operating within the same AOV range and shows why CTR is more useful when compared within your industry.
However, CTR only tells you how often people click after seeing an ad. To understand the value of those clicks, compare it with CPC and conversion rate to see what you are paying for traffic and how often that traffic turns into customers.
Meta Ads CTR benchmarks by industry and AOV
| Industry | Under $50 | $50–$100 | $100–$200 | $200+ |
|---|---|---|---|---|
| Beauty & Wellness | 1.22% | 1.33% | 1.42% | 1.33% |
| Electronics & Gaming | 1.50% | 1.69% | 1.83% | 1.79% |
| Fashion | 1.57% | 2.23% | 2.46% | 1.78% |
| Fitness & Outdoors | 1.50% | 1.43% | 1.79% | 1.34% |
| Food, Beverage & Pet | 1.29% | 1.40% | 1.21% | 1.79% |
| Home & Lifestyle | 1.93% | 1.72% | 2.03% | 1.89% |
| Jewellery & Accessories | 1.50% | 1.92% | 1.87% | 1.98% |
| Services & Other | 1.52% | 1.72% | 1.70% | 2.28% |
Once people click, the next question is whether that traffic turns into customers. This is where conversion rate adds another important part of the comparison.
Meta Ads Conversion Rate Benchmarks
Conversion rate (CR) shows how often traffic attributed to Meta results in a purchase. While CTR helps evaluate how effectively ads generate traffic, conversion rate brings the comparison closer to the final outcome by showing how often that traffic converts.
What is a good conversion rate for Meta Ads?
Conversion rate generally decreases as AOV increases. This pattern appears across most industries in the benchmark data.
For example, in Fashion, the conversion rate decreases from 2.18% for businesses with an AOV below $50 to 1.06% for businesses with an AOV above $200. Home & Lifestyle shows a similar difference, from 3.04% to 0.92%.
This is useful context for stores selling higher-priced products. A 1% conversion rate may look low compared with a general Meta Ads benchmark, but it can be much closer to the benchmark for businesses with an AOV above $200.
Meta Ads conversion rate benchmarks by industry and AOV
| Industry | Under $50 | $50–$100 | $100–$200 | $200+ |
|---|---|---|---|---|
| Beauty & Wellness | 2.78% | 2.83% | 1.98% | 0.83% |
| Electronics & Gaming | 2.79% | 2.15% | 1.63% | 1.02% |
| Fashion | 2.18% | 1.80% | 1.33% | 1.06% |
| Fitness & Outdoors | 2.59% | 2.37% | 1.69% | 1.33% |
| Food, Beverage & Pet | 3.23% | 4.23% | 1.60% | 1.02% |
| Home & Lifestyle | 3.04% | 2.21% | 1.59% | 0.92% |
| Jewellery & Accessories | 2.59% | 1.33% | 1.72% | 1.39% |
| Services & Other | 2.57% | 1.95% | 1.78% | 0.95% |
Conversion rate gives you the final result, but it does not show where visitors who did not purchase stopped progressing. Add-to-cart and initiated checkout rates can fill in that gap.
Meta Ads Add-to-Cart Rate Benchmarks
Add-to-cart rate (ATCR) shows how often shoppers coming from Meta add a product to their cart. This gives you another point of comparison between generating the click and completing the purchase, which can help when strong traffic metrics are not translating into the conversion results you expect.
What is a good add-to-cart rate for Meta Ads?
Add-to-cart rate tends to decrease as AOV increases across many industries.
For example, Beauty & Wellness has an add-to-cart rate of 13.05% for businesses with a $50–$100 AOV, compared with 7.89% at $100–$200 and 3.33% above $200.
Looking at ATCR alongside CTR can also help you understand where customers are dropping off. If your CTR is close to the benchmark but your add-to-cart rate is much lower, people are clicking your ads but fewer are continuing to add a product to their cart.
Meta Ads add-to-cart rate benchmarks by industry and AOV
| Industry | Under $50 | $50–$100 | $100–$200 | $200+ |
|---|---|---|---|---|
| Beauty & Wellness | 12.08% | 13.05% | 7.89% | 3.33% |
| Electronics & Gaming | 12.36% | 9.64% | 9.69% | 5.66% |
| Fashion | 10.53% | 12.54% | 9.04% | 6.68% |
| Fitness & Outdoors | 11.02% | 11.38% | 9.01% | 5.76% |
| Food, Beverage & Pet | 12.50% | 17.14% | 7.72% | 5.66% |
| Home & Lifestyle | 13.92% | 9.95% | 10.85% | 5.33% |
| Jewellery & Accessories | 11.02% | 10.92% | 11.82% | 6.25% |
| Services & Other | 8.70% | 9.08% | 11.24% | 5.67% |
For visitors who do add a product to their cart, the initiated checkout rate provides the next point of comparison and helps show whether they continue moving toward purchase.
Meta Ads Initiated Checkout Rate Benchmarks
Initiated checkout rate (ICR) shows how often shoppers coming from Meta progress to checkout. When viewed alongside ATCR and conversion rate, it gives you a clearer picture of how visitors move through the later stages of the purchase journey.
What is a good initiated checkout rate for Meta Ads?
Initiated checkout rate generally decreases as AOV increases, following a similar pattern to conversion rate and add-to-cart rate.
For example, Home & Lifestyle has an initiated checkout rate of 7.74% for businesses with an AOV below $50, compared with 2.07% for businesses with an AOV above $200.
It is useful to compare ICR with your add-to-cart rate. If your add-to-cart rate is close to the benchmark but your initiated checkout rate is lower, customers are adding products to their carts but fewer are continuing to checkout.
Meta Ads initiated checkout rate benchmarks by industry and AOV
| Industry | Under $50 | $50–$100 | $100–$200 | $200+ |
|---|---|---|---|---|
| Beauty & Wellness | 5.26% | 5.66% | 3.69% | 1.79% |
| Electronics & Gaming | 5.30% | 4.93% | 3.41% | 2.38% |
| Fashion | 5.26% | 4.02% | 2.71% | 2.61% |
| Fitness & Outdoors | 5.38% | 5.47% | 3.42% | 3.06% |
| Food, Beverage & Pet | 6.02% | 7.13% | 3.32% | 2.38% |
| Home & Lifestyle | 7.74% | 4.67% | 3.56% | 2.07% |
| Jewellery & Accessories | 5.38% | 3.97% | 3.46% | 3.39% |
| Services & Other | 4.97% | 3.87% | 3.99% | 2.21% |
What We Can Learn From the Meta Ads Benchmarks
Looking at all eight metrics together gives us a much more complete view of Meta Ads performance than comparing CAC, ROAS, or CTR separately.
One of the clearest patterns is the difference between AOV groups. Higher-AOV businesses generally have higher CAC benchmarks and lower conversion benchmarks. Beauty & Wellness, for example, moves from a $20.31 CAC and 2.78% conversion rate below $50 AOV to a $64.33 CAC and 0.83% conversion rate above $200. Fashion shows a similar change, with CAC increasing from $15.37 to $75.50 while conversion rate decreases from 2.18% to 1.06%.
The data also shows why strong results at the top of the funnel do not always continue through to purchase. Fashion businesses in the $100–$200 group have their highest CTR benchmark at 2.46%, but their conversion rate is 1.33%, lower than the 2.18% benchmark for Fashion businesses below $50 AOV. A strong click-through rate therefore tells us that ads are generating traffic effectively, but we still need ATCR, ICR, and conversion rate to understand what happens to that traffic.
This creates a useful way to read the benchmarks as a connected funnel:
CPM → CTR and CPC → ATCR → ICR → Conversion Rate → CAC and ROAS
When CPM is close to benchmark but CTR is lower, the first noticeable difference is between impressions and clicks. When CTR is strong but ATCR is below benchmark, visitors are reaching the store but fewer are adding products to their carts. If ATCR is in line with the market but ICR is lower, the difference appears between cart and checkout.
The benchmarks cannot tell you the reason for that difference on their own, but they can show you where your performance starts to move away from comparable businesses, which gives you a much more useful starting point for further analysis.
How to Compare Your Meta Ads Performance With These Benchmarks
Start by finding the industry and AOV range that most closely match your business, then compare your own metrics with that group rather than trying to evaluate every result against an overall Meta Ads average.
From there, look at the metrics together. If your CPM and CTR are close to benchmark but conversion rate is considerably lower, increasing traffic may not be the first place to focus. If CPC is above benchmark but CAC and ROAS are strong, the higher cost per click may not be hurting your overall acquisition performance.
The same approach works further down the funnel. When CTR is strong but ATCR is lower than the benchmark, you know the larger difference appears after the click. When ATCR is healthy but ICR falls behind, you can narrow that comparison further to the transition from cart to checkout.
The goal is not to have every metric above or below a particular benchmark. It is to understand how your performance compares with similar ecommerce businesses and where the largest differences appear across the funnel.
How to Improve Your Meta Ads Metrics
Once you’ve compared your performance with the benchmarks, use the metrics together to understand where there may be room to improve. Start with the metric showing the largest difference, then look at the related metrics before deciding what to change.
| If you see… | What to review |
|---|---|
| High CPM | Review your audience targeting , placements , and campaign structure. Compare CPM with CPC and CAC as well, since higher impression costs do not necessarily lead to inefficient customer acquisition. |
| Low CTR | Review your ad creative , messaging, formats, offers, and calls to action. If CTR is consistently below benchmark, see our guide on how to improve your Meta Ads CTR for a more detailed look at what to test. |
| High CPC | Look at CPM and CTR together. If CPM is close to benchmark but CTR is low, the difference may be coming from how effectively your ads generate clicks rather than how much you pay for impressions. |
| Low ATCR or ICR | Review the experience after the click, including how well the landing page matches the ad, product information, pricing, shipping details, and the path from product page to checkout. It is also worth reviewing whether you are optimizing for landing page views or conversions . |
| Low conversion rate | Compare conversion rate with ATCR and ICR to identify where the largest difference appears between visiting the store, adding to cart, starting checkout, and purchasing. |
| High CAC or low ROAS | Look across the full funnel rather than treating CAC or ROAS as isolated metrics. Review CPM, CTR, and CPC first, followed by ATCR, ICR, and conversion rate, to identify where performance starts to differ from your benchmarks. |
Compare Your Meta Ads Performance With the Market
You do not need to manually find your industry, AOV range, and benchmark every time you analyze your Meta Ads performance.
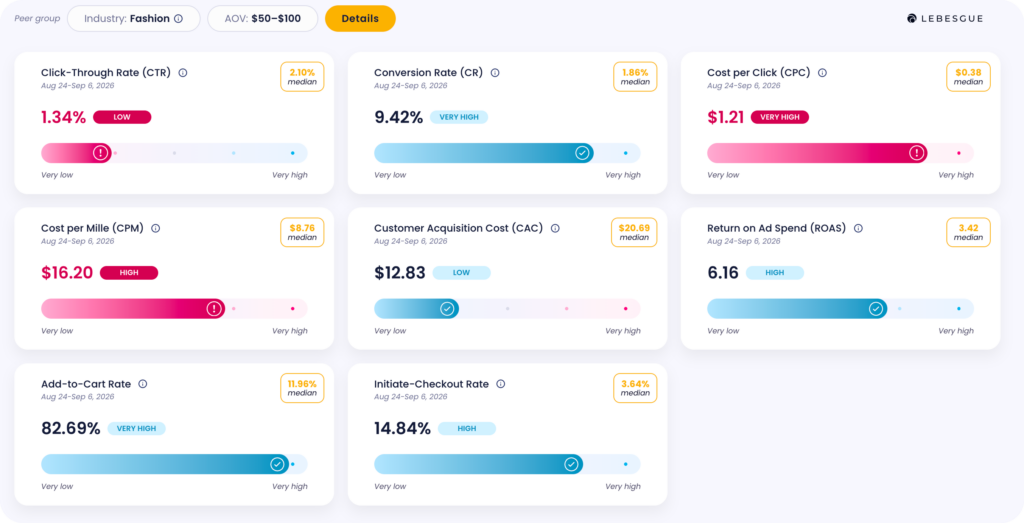
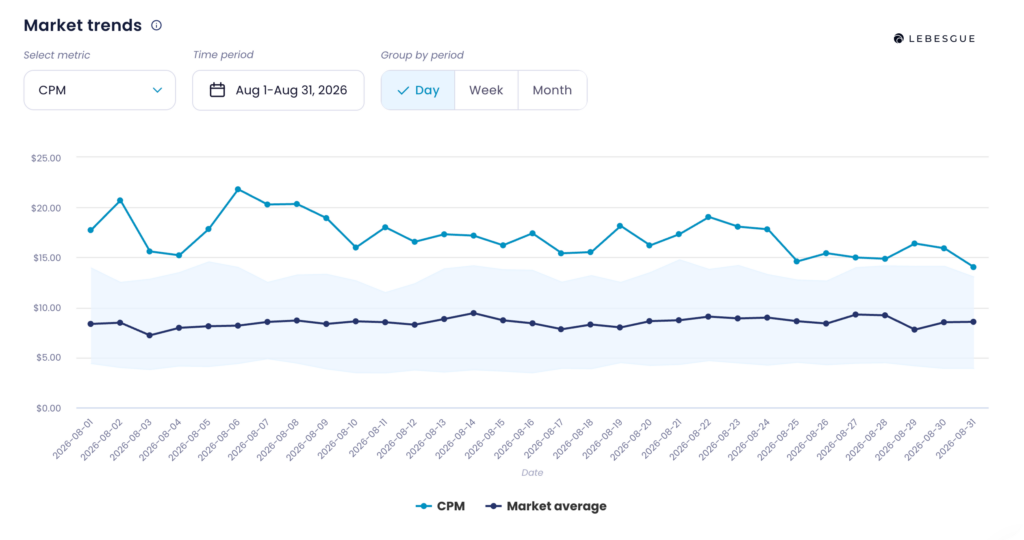
With Lebesgue Market Benchmarks, your Meta Ads results are automatically compared with ecommerce businesses in a similar industry and AOV range. You can see how your CAC, ROAS, CPC, CPM, CTR, conversion rate, add-to-cart rate, and initiated checkout rate compare with the market and use those comparisons to understand where your performance differs from similar businesses.
Frequently Asked Questions about Meta Ads Benchmarks
Meta Ads benchmarks are reference points that help you compare your advertising performance with other businesses. Metrics such as CAC, ROAS, CTR, CPC, CPM, conversion rate, ATCR, and ICR become more useful when they are compared with businesses in a similar industry and AOV range rather than with one broad Meta Ads average.
There is no single CAC that can be applied to every ecommerce business. In our data, CAC varies considerably by industry and AOV, ranging from around $15 in some lower-AOV segments to more than $70 in some $200+ segments. The most relevant starting point is therefore the benchmark for your own industry and AOV range.
A good Meta Ads ROAS depends on the type of business and the value of its orders. At $100–$200 AOV, for example, the median ROAS in our data ranges from 1.82x for Food, Beverage & Pet to 4.17x for Home & Lifestyle, showing why one ROAS target cannot represent every ecommerce advertiser.
CTR differs across industries even when AOV is similar. Among businesses with a $100–$200 AOV, median CTR ranges from 1.21% for Food, Beverage & Pet to 2.46% for Fashion. For a useful comparison, look at the benchmark closest to your industry and AOV and then consider CTR together with CPC and conversion performance.
Conversion rate varies considerably with AOV in our benchmark data, with higher-AOV groups generally recording lower median conversion rates. Beauty & Wellness, for example, has a median conversion rate of 2.78% below $50 AOV and 0.83% above $200. This is why AOV should be included when comparing your Meta conversion rate.
CAC and ROAS show the final acquisition and revenue results, while CPM, CTR, and CPC help explain how efficiently ads generate traffic. ATCR, ICR, and conversion rate then show how that traffic progresses toward a purchase. Looking at these metrics together gives you a clearer picture of where your Meta Ads performance is strong and where it differs from the market.