Quickly Understand What Changed in Your Google Ads Account
Google Ads gives ecommerce brands a lot of data, but analyzing that data is not always easy. You can see clicks, conversions, ROAS, spend, and revenue, but those numbers do not always explain what actually changed or what you should do next.
For example, if ROAS drops, the problem might not be the campaign itself. It could be a product issue, a landing page issue, lower conversion rate, weaker demand, or a shift in which products are selling. That’s why looking at Google Ads in isolation often gives you only part of the story.
This is where AI can help. By connecting Google Ads performance with store data, product performance, and customer behavior, AI can help you understand what is happening faster and make better decisions.
In this article, we’ll look at how Lebesgue helps you analyze your Google Ads account through Google Analytics, Product Performance, Product Strategy, and Henri – Google Ads AI agent.
Analytics Tab
Start with Analytics to get a quick overview of Google Ads performance
The first step in analyzing a Google Ads account is understanding the overall performance. Before looking at individual products or making strategic decisions, you need to know what changed in the account and where the biggest issues or opportunities are.
In Lebesgue, the Analytics tab gives you a quick overview of your Google Ads performance in one place. Instead of switching between different reports, you can immediately see the key metrics that matter most, such as spend, impressions, clicks, CPC, CTR, conversion rate, purchases, CAC, and ROAS.
This makes it easier to understand whether performance is improving or declining, and which metric is driving the change.
For example, if ROAS dropped, you can quickly check whether the issue came from higher CPC, lower conversion rate, fewer purchases, or increased customer acquisition cost.
You can also go deeper into performance by campaign, ad group, and individual ads. This helps you understand which parts of the account are responsible for the overall results. A campaign may be spending the most budget, but that does not always mean it is driving the best performance. By comparing campaigns, ad groups, and ads side by side, you can quickly spot where budget is working well and where it may be underperforming.
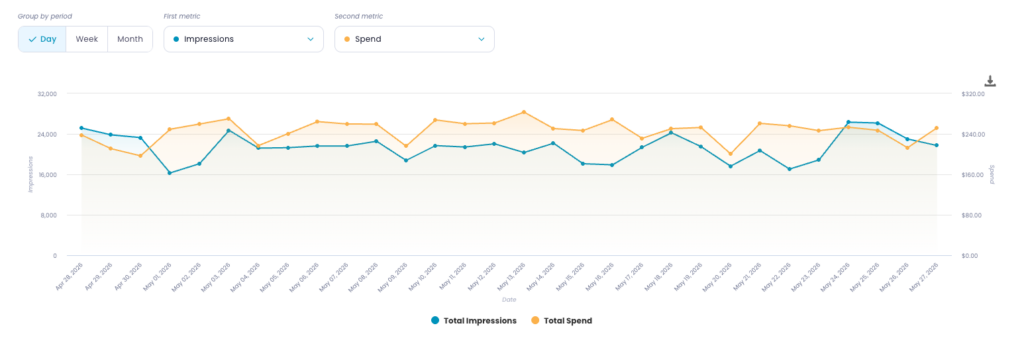
The graphs make this even easier by showing how selected metrics move over time. You can compare metrics such as spend and impressions, clicks and conversions, or ROAS and CAC (etc.) to understand trends and identify sudden changes. This is useful when you want to see whether a performance shift happened gradually or if something changed on a specific day.
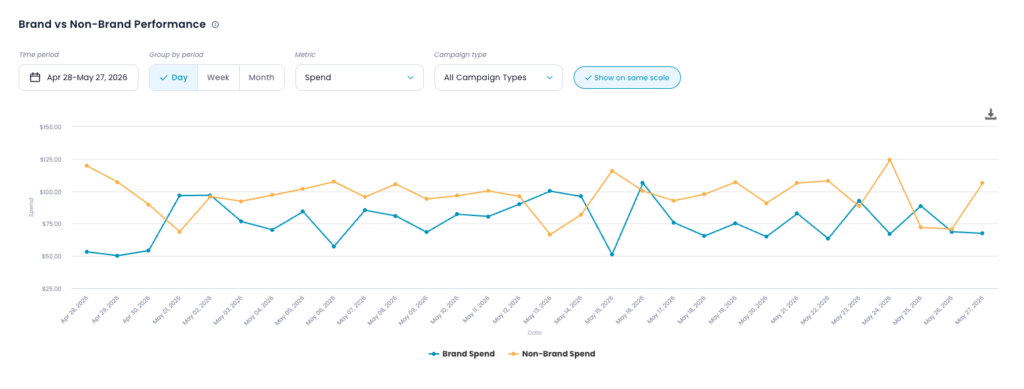
Lebesgue also separates brand and non-brand performance, which is important for understanding the real impact of your Google Ads campaigns. Brand campaigns often have stronger results because they capture people who already know your business, while non-brand campaigns show how well you are reaching and converting new customers. Looking at both separately gives you a more accurate picture of account performance.
For Performance Max campaigns, Lebesgue also shows a channel breakdown and metrics overview. This helps you understand how your PMax budget is distributed across channels such as Search, Shopping, YouTube, Display, Discover, Gmail, and Search Partners. Instead of treating Performance Max as a black box, you can see where spend is going and which channels are contributing to conversions.
This first layer of analysis helps you answer the most important questions quickly: Is performance improving or getting worse? Which campaigns are driving the change? Are brand and non-brand campaigns behaving differently? And how is Performance Max actually spending your budget?
Once you understand the overall account performance, you can move one level deeper and analyze which products are actually driving the results.
Product Performance Tab
Analyze product performance to see what is actually driving results
After checking the overall account performance, the next step is to understand which products are driving the results.
This is especially important for ecommerce brands because Google Ads performance is not only about campaigns. In Performance Max and Shopping campaigns, individual products can behave very differently. Some products may get a lot of impressions and clicks but very few conversions. Others may convert well but receive much less visibility.
Lebesgue’s Google Product Performance Analysis helps you see this clearly by breaking Google Ads performance down to the product level. Instead of only looking at campaign-level metrics, you can see how each product contributes to impressions, clicks, spend, conversions, conversion value, and ROAS.
The Engagement and Conversion chart gives you a quick visual overview of your top products. Products are grouped based on how much visibility they receive and how well they convert. This helps you quickly spot best sellers, products with high potential, and products that may be wasting budget.
For example, a product in the Best Sellers area has both strong engagement and strong conversions. These are the products already performing well.
A product in the Highest Potential area has strong conversions but lower engagement, which means it may deserve more visibility.
A product in the Alerts area gets engagement but does not convert well, which makes it worth investigating.
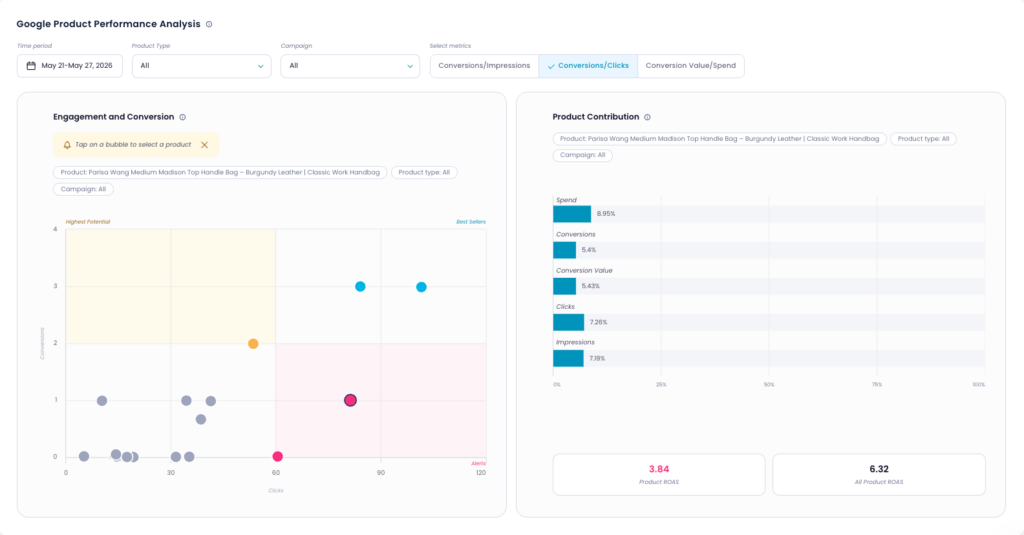
The Product Contribution panel adds more context by showing how much one selected product contributes to total spend, conversions, conversion value, clicks, and impressions. This makes it easier to see whether a product is getting more budget than it deserves or whether it is generating strong revenue with relatively little spend.
This is useful because absolute ROAS can be misleading. A product may look good on its own, but if its ROAS is below the account average, it may still be pulling overall performance down. On the other hand, a product with lower spend but strong conversion value may be a better candidate for scaling.
Lebesgue also includes a product data table, where you can search, sort, and compare individual products by key Google Ads metrics. This makes it easier to find high-spend products, low-converting products, or products that are performing better than expected.
The Comparative Periods View helps you understand how product performance changed over time. You can compare the current period with the previous period and quickly see which products gained or lost visibility, which ones improved, and which ones declined. This can help reveal issues that are not obvious in standard Google Ads reporting, such as feed problems, inventory changes, or products suddenly losing impressions.
Finally, the Performance by Product Type section gives you a higher-level view of product categories. Instead of only analyzing individual products, you can see which product types generate the most revenue, which categories deserve more budget, and which ones may need to be reduced or restructured.
By looking at Google Ads through the product lens, you get a much clearer answer to one of the most important questions in ecommerce advertising: which products are actually driving growth, and which ones are just consuming budget?
Product Strategy Tab
Turn product insights into a clear product strategy
Once you understand which products are driving results, the next step is deciding what to do with that information.
This is where Product Strategy comes in. Instead of only showing product-level performance, Lebesgue turns your Google Ads product data into a clear decision-making framework. It helps you understand which products should be scaled, which ones are wasting budget, and which ones need more testing.
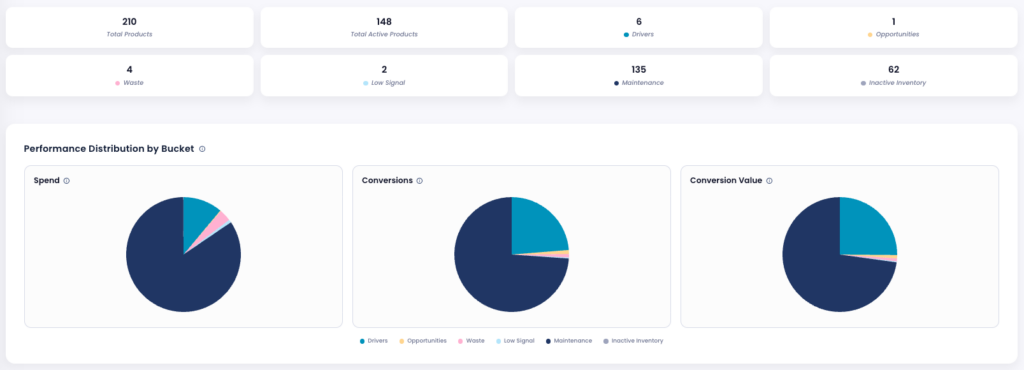
The Product Strategy tab analyzes your catalog over the last 30/60/90/180 days and groups products into strategic buckets. This gives you a quick overview of how your catalog is performing inside Google Ads.
Products are grouped into six main categories:
- Drivers are products with high visibility and strong results. These are the products already generating revenue and conversions.
- Opportunities are products that perform well but do not get enough visibility. These products may be good candidates for more budget or better campaign support.
- Waste products receive spend but deliver weak results. These are the products that may be consuming budget without generating enough revenue.
- Low Signal products get some visibility but do not show strong market response yet. These may need more testing, better product positioning, or improved feed data.
- Maintenance products have stable, average performance. They are not the biggest growth drivers, but they are not necessarily a problem either.
- Inactive Inventory includes products with very little or no exposure in Google Ads. These products have not been meaningfully tested yet.
This makes it much easier to understand your catalog at a strategic level. Instead of looking through hundreds of products manually, you can quickly see how many products are driving growth, how many are inactive, and how many are wasting budget.
The Performance Distribution by Bucket charts show how each group contributes to spend, conversions, and conversion value. This is useful because it shows whether your budget is going to the products that actually generate revenue. For example, if Waste products take a large share of spend but generate a small share of conversion value, that is a clear sign that budget could be used more efficiently.
Lebesgue also highlights action items directly in the tab. The Top Opportunities table shows products that may be ready to scale, while the Top Waste table shows products that are burning budget and should be reviewed first. This helps you move from analysis to action faster.
The Budget & Conversion Share charts make this even clearer by comparing spend share with conversion value share. Ideally, your strongest products should generate at least as much conversion value as the budget they receive. If a product group has a much higher spend share than conversion value share, it may be pulling down overall performance.
Finally, the Product Breakdown table lets you review individual products, filter by bucket, and search for specific items. This gives you a practical way to act on the strategy: review Waste products, identify Drivers, find Opportunities, and understand which parts of your catalog need more attention.
Product Strategy helps answer the questions that standard Google Ads reports often leave open: Which products should we push? Which ones should we reduce spend on? Where are we wasting budget? And where is the real room for growth?
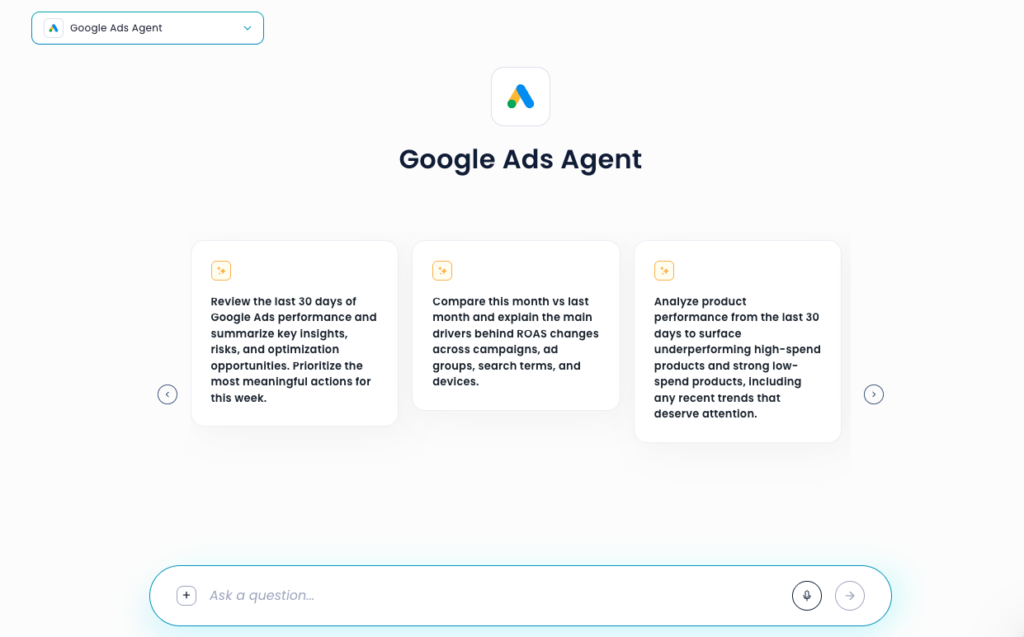
Henri - Google Ads Agent
Ask Henri, your Google Ads AI agent, to dig deeper
The Analytics, Product Performance, and Product Strategy tabs give you a strong overview of what is happening in your Google Ads account. You can quickly check performance, understand which products are driving results, and see where budget is being wasted.
But sometimes, you need to go deeper than a dashboard.
This is where Henri, Lebesgue’s Google Ads AI agent, makes the biggest difference. Instead of manually building reports, switching between views, or trying to compare multiple data points yourself, you can simply ask a question in plain English.
Henri can analyze your Google Ads performance across campaigns, ad groups, ads, keywords, products, search terms, landing pages, and Performance Max data. It can pull live data from your connected Google Ads account, compare periods, calculate key metrics, and explain what changed.
This makes it much easier to answer questions that would normally take a long time to investigate manually.
For example, you can ask Henri to compare sale periods year over year and explain what actually changed. Did revenue increase because spend went up, or because the account became more efficient? Did ROAS improve because conversion rate was higher, or because a few products performed better than last year?
This kind of analysis is possible manually, but it usually takes a lot of filtering, exporting, and comparing reports.
You can also ask Henri to analyze brand vs. non-brand performance. This is useful because brand campaigns often look stronger, but they do not always show how well you are acquiring new customers. Henri can help separate the two and explain whether growth is coming from people already searching for your brand or from new demand generated through non-brand campaigns.
Another useful example is product mix analysis. If ROAS changes, the reason may not be the campaign itself. It could be that Google started pushing different products, or that last year’s top-selling products are not driving the same results this year. Henri can help identify which products had the biggest impact on performance and whether the change came from spend, visibility, conversion rate, or conversion value.
Henri can also help with budget efficiency. You can ask where spend increased without a proportional increase in revenue, which campaigns are becoming less efficient, or where incremental budget could have the strongest impact. This helps you move from “we spent more” to “we know where spend is actually working.”
For Performance Max campaigns, Henri can help explain what is happening across channels such as Search, Shopping, YouTube, Display, Discover, Gmail, and Search Partners. Instead of treating PMax like a black box, you can ask which channels are driving spend, which are driving conversions, and whether the distribution changed over time.
You can also use Henri for search term analysis, landing page analysis, day-of-week and hour-of-day performance, and change audits. For example, you can ask it to review recent budget changes, bid strategy changes, asset updates, or negative keyword additions and check whether they may be connected to a performance shift.
The biggest advantage is speed. You can still use the individual tabs when you want to explore the data yourself, but when you need a faster answer or a deeper explanation, Henri helps you get there in minutes instead of hours.
This is what makes AI so useful for Google Ads analysis. It does not just show you more data. It helps you understand what changed, why it changed, and what to do next.
Examples of Google Ads questions AI can help answer
The biggest benefit of using AI for Google Ads analysis is that you can stop thinking only in terms of reports and start asking the questions that actually matter for growth.
Instead of manually checking campaigns, products, search terms, and performance charts one by one, you can ask your Google Ads AI agent to connect those data points for you. This helps you move faster from “what happened?” to “why did it happen?” and “what should we do next?”
Here are a few examples of questions AI can help answer:
Why did ROAS drop last week?
- A drop in ROAS can happen for many reasons. Spend may have increased faster than revenue, CPC may have gone up, conversion rate may have dropped, or Google may have started pushing different products. AI can help compare these signals and identify the most likely cause.
Which products are wasting budget?
- Campaign-level performance can hide product-level problems. AI can help find products that receive impressions, clicks, and spend but do not generate enough conversions or revenue.
Which products should we scale?
- Some products may convert well but receive limited visibility. AI can help surface products with strong conversion value, good efficiency, or high potential that may deserve more budget or better campaign support.
Did our sale perform better than last year?
- Year-over-year sale analysis can take a long time manually. AI can compare sale periods and explain whether performance changed because of spend, ROAS, conversion rate, product mix, or customer demand.
Are brand campaigns hiding weaker non-brand performance?
- Brand campaigns often look strong because they capture existing demand. AI can separate brand and non-brand performance, making it easier to understand whether growth is coming from people already searching for your brand or from new customer acquisition.
What changed after recent account updates?
- Budget shifts, bid strategy changes, new assets, and negative keyword updates can all affect performance. AI can review recent changes and help identify whether they may be connected to a performance shift.
What should we focus on this week?
- Instead of reviewing every report manually, AI can summarize the biggest risks, opportunities, and actions, helping you decide where to focus first.
Summing Up
Analyzing a Google Ads account is not just about checking whether ROAS went up or down. For ecommerce brands, performance depends on many connected factors: campaign structure, traffic quality, product visibility, conversion rate, product mix, budget allocation, and customer demand.
That is why looking at Google Ads in isolation often leads to incomplete conclusions. You might see that performance dropped, but not understand whether the issue came from higher CPC, weaker product performance, wasted budget, or a shift in what Google started promoting.
AI makes this process much faster. With Lebesgue, you can start with a quick Analytics overview, go deeper into Product Performance, use Product Strategy to understand what to scale or reduce, and then ask Henri to investigate the questions that would normally take hours to answer manually.
The goal is not just to collect more data. The goal is to understand what changed, why it changed, and what action to take next.
For ecommerce teams, this means faster reporting, better product-level decisions, and a clearer understanding of where Google Ads budget is actually working. Instead of spending time digging through dashboards, you can focus on improving performance and growing the business.
Frequently Asked Questionsabout TikTok Ads Benchmarks
The best way to analyze Google Ads performance for ecommerce is to look beyond campaign-level metrics and connect advertising data with product performance, conversion rates, revenue, and customer behavior. This helps identify whether changes in ROAS are caused by traffic quality, product mix, conversion issues, or budget allocation.
A ROAS drop can happen for many reasons, including higher CPCs, lower conversion rates, changes in product demand, inventory issues, or shifts in product visibility. Looking at ROAS alone rarely explains the root cause, which is why deeper analysis is needed.
AI can analyze campaigns, products, search terms, landing pages, and conversion data simultaneously. Instead of manually comparing reports, AI can identify performance changes, explain likely causes, and recommend actions to improve results.
Google Product Performance Analysis helps ecommerce brands understand how individual products contribute to impressions, clicks, spend, conversions, revenue, and ROAS. This makes it easier to identify best sellers, high-potential products, and products that may be wasting budget.
Look for products that receive significant impressions, clicks, and spend but generate few conversions or little revenue. Product-level analysis can reveal inefficient products that may be hidden inside otherwise successful campaigns.
Brand campaigns target people already searching for your business, while non-brand campaigns target new potential customers. Separating these results provides a clearer picture of customer acquisition performance and overall account growth.
Performance Max analysis should include channel-level performance across Search, Shopping, YouTube, Display, Discover, Gmail, and Search Partners. Understanding where budget is being spent helps uncover opportunities and inefficiencies that are often hidden in standard reports.
Yes. AI can identify products with strong conversion rates, high conversion value, and limited visibility, helping advertisers find products that may benefit from additional budget or campaign support.
Henri is Lebesgue’s AI marketing agent that analyzes Google Ads performance using live account data. It can investigate campaigns, products, keywords, search terms, landing pages, and Performance Max campaigns, helping ecommerce teams understand what changed and what actions to take next.
Lebesgue combines Google Ads data with ecommerce performance data through Analytics, Product Performance, Product Strategy, and Henri AI. This helps brands identify growth opportunities, reduce wasted spend, improve product-level decisions, and understand how advertising impacts overall business performance.
No. AI helps automate analysis and uncover insights faster, but marketers still make strategic decisions. AI acts as a tool that reduces reporting time and helps teams focus on optimization and growth opportunities.