
If you’re a digital marketer or an eCommerce business owner using Facebook ads to reach your target audience, it’s essential to understand the latest Facebook ad CR benchmarks to measure your campaign’s success.
Facebook keeps adding new possibilities and features to its ads, which affects advertising metrics. In this blog post, we’ll explore the most up-to-date conversion rate benchmarks for Facebook ads in 2024.
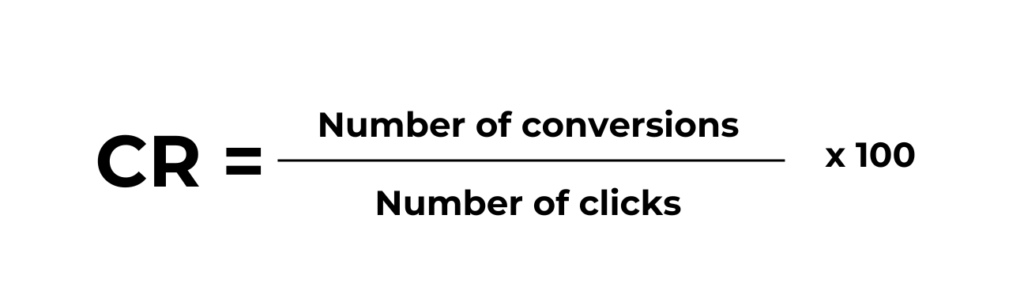
Before diving into the benchmarks, let’s recap what conversion rate (CR) means. In the context of Facebook advertising, the conversion rate is the percentage of users who took a desired action after clicking on your ad.
This action could be anything from making a purchase, signing up for a newsletter, or filling out a contact form. As we primarily work with eCommerce businesses, the conversion rate in this case refers specifically to the percentage of customers who make a purchase after clicking on your ad.
2024 Facebook Ad CR Benchmarks
Now, that we are on the same page about what conversion rate is, let’s see the deep analytics that we did regarding CR.
It’s important to note that the conversion rate can vary significantly across industries, ad formats, and targeting strategies. The following benchmarks provide a general overview of what you can expect.
CR Benchmarks by Campaign Type
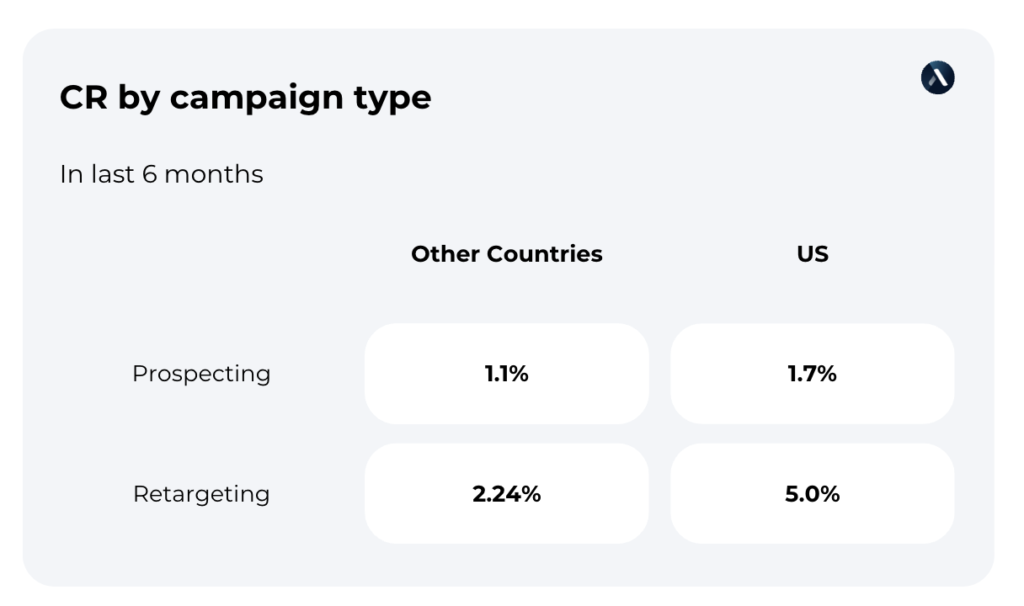
When analyzing the CR benchmarks by audience type, the data reveals distinct patterns. Retargeting ads have significantly higher CRs compared to those for prospecting. The median CR for retargeting campaigns is at 3,8% while prospecting lags at 1.5%.
With more detailed analysis, we find a noteworthy discrepancy in retargeting CRs between the US and the rest of the world. In the US, retargeting archives a remarkable 5.0% CR, outshining the 2.4% CR for the rest of the world. However, when it comes to prospecting, there is a less substantial difference in CRs. The US records a 1.7% CR, while others see a lower rate of 1.1%.
CR Benchmarks by months
Now, let’s see the CR through the year. For prospecting, the conversion rates show a gradual increase from January (1.27%) to March (1.94%), peaking in May (2.01%), and then stabilizing with slight fluctuations until November (2.28%).
December closes the year with a CR of 1.62%
On the other hand, retargeting campaigns display a different trend. January starts with a notable high CR of 5.79%, which remains relatively consistent until March (5.48%).
From April (4.31%) to August (3.86%), there is a downward trend, but it picks up again in September (4.22%) and significantly increases in October (5.88%) and November (5.52%). The year concluded with a CR of 4.97% in December.
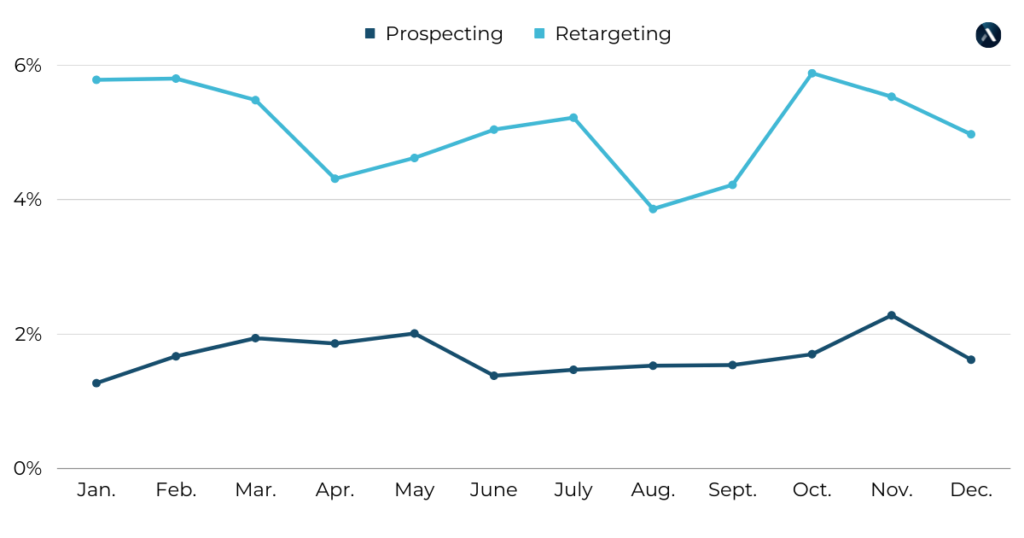
These month-by-month CR benchmarks highlight the importance of considering seasonal trends and adjusting ad strategies to optimize conversion rates throughout the year.
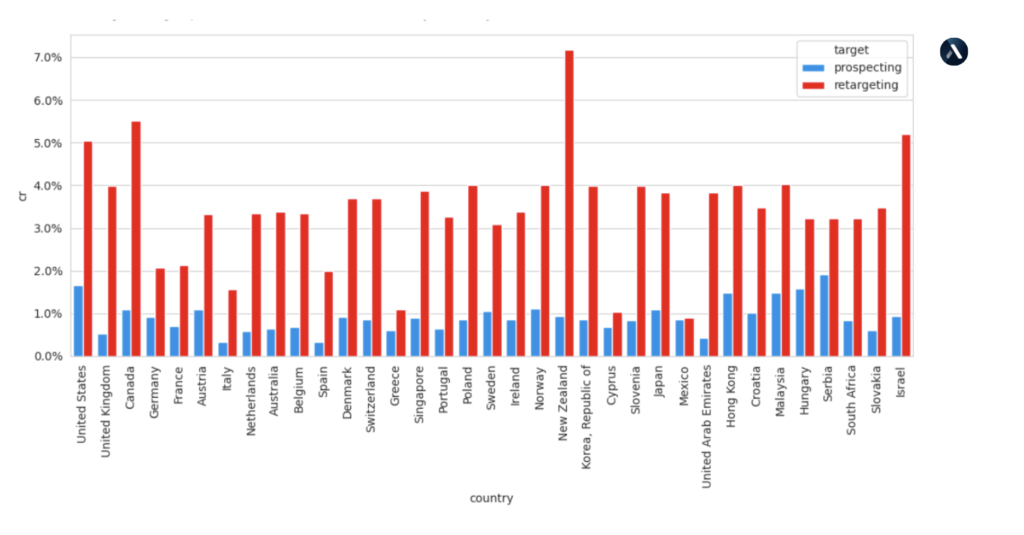
CR Benchmarks by Country
As indicated by the data below, the United States indeed stand out as the country with the highest conversion rate in prospecting campaigns, with a CR of 1.66%. In contrast, other countries like the United Kingdom and Canada have low prospecting CRs of 0.53% and 0.11%, respectively.
In the realm of retargeting campaigns, the trend continues, with the United States boasting a relatively high CR of 5.04%. Meanwhile, New Zealand takes the lead in retargeting CR with an impressive rate of 7.17%.
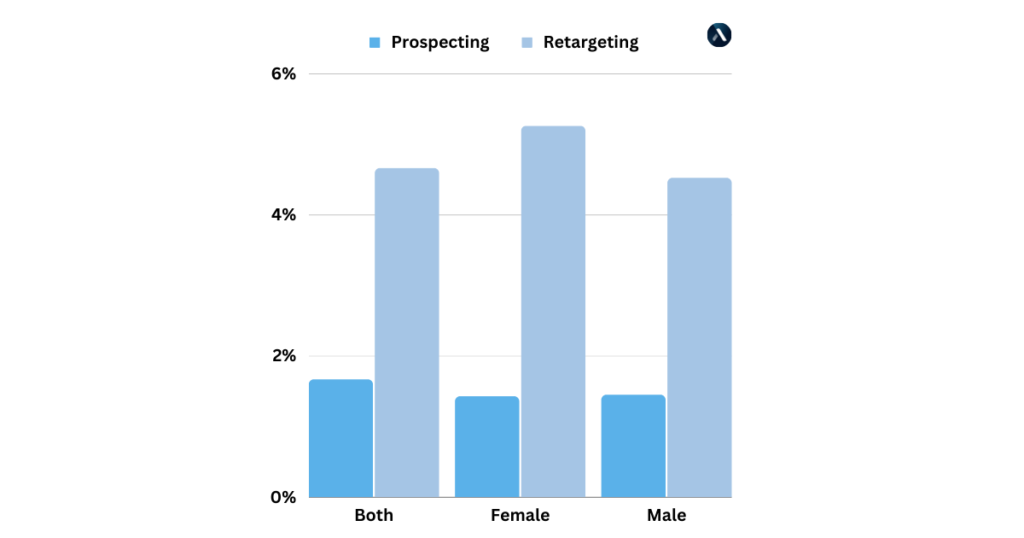
CR Benchmarks by Gender
And, for the end, let’s see the CR benchmarks by gender. In prospecting campaigns, the CRs differ slightly based on gender. The data shows that campaigns targeting both genders have a CR of 1.67%. Meanwhile, campaigns specifically targeting females achieve a slightly lower CR of 1.43%, and those targeting males obtain a similar CR of 1.45%.
For retargeting campaigns, gender-based CRs also reveal interesting insights. When targeting both genders, the CR reaches 4.66%. However, when focusing exclusively on females, the CR increases to 5.26%, surpassing the rate for males at 4.52%.
Summing up: Facebook Ad CR
Understanding the latest Facebook Ad CR benchmarks is crucial for measuring the success of your campaigns. As we’ve seen, conversion rates can vary depending on various factors, including audience type, country, and gender. By staying informed about these benchmarks, you can set realistic expectations and optimize your ad strategies for better results.
⭐⭐⭐⭐⭐
100+ five-star reviews on Shopify App Store
Be the first to receive the latest Facebook ads benchmarks, insights, and tips right in your inbox.


No comment yet, add your voice below!