Before you scale BFCM spend, benchmark it
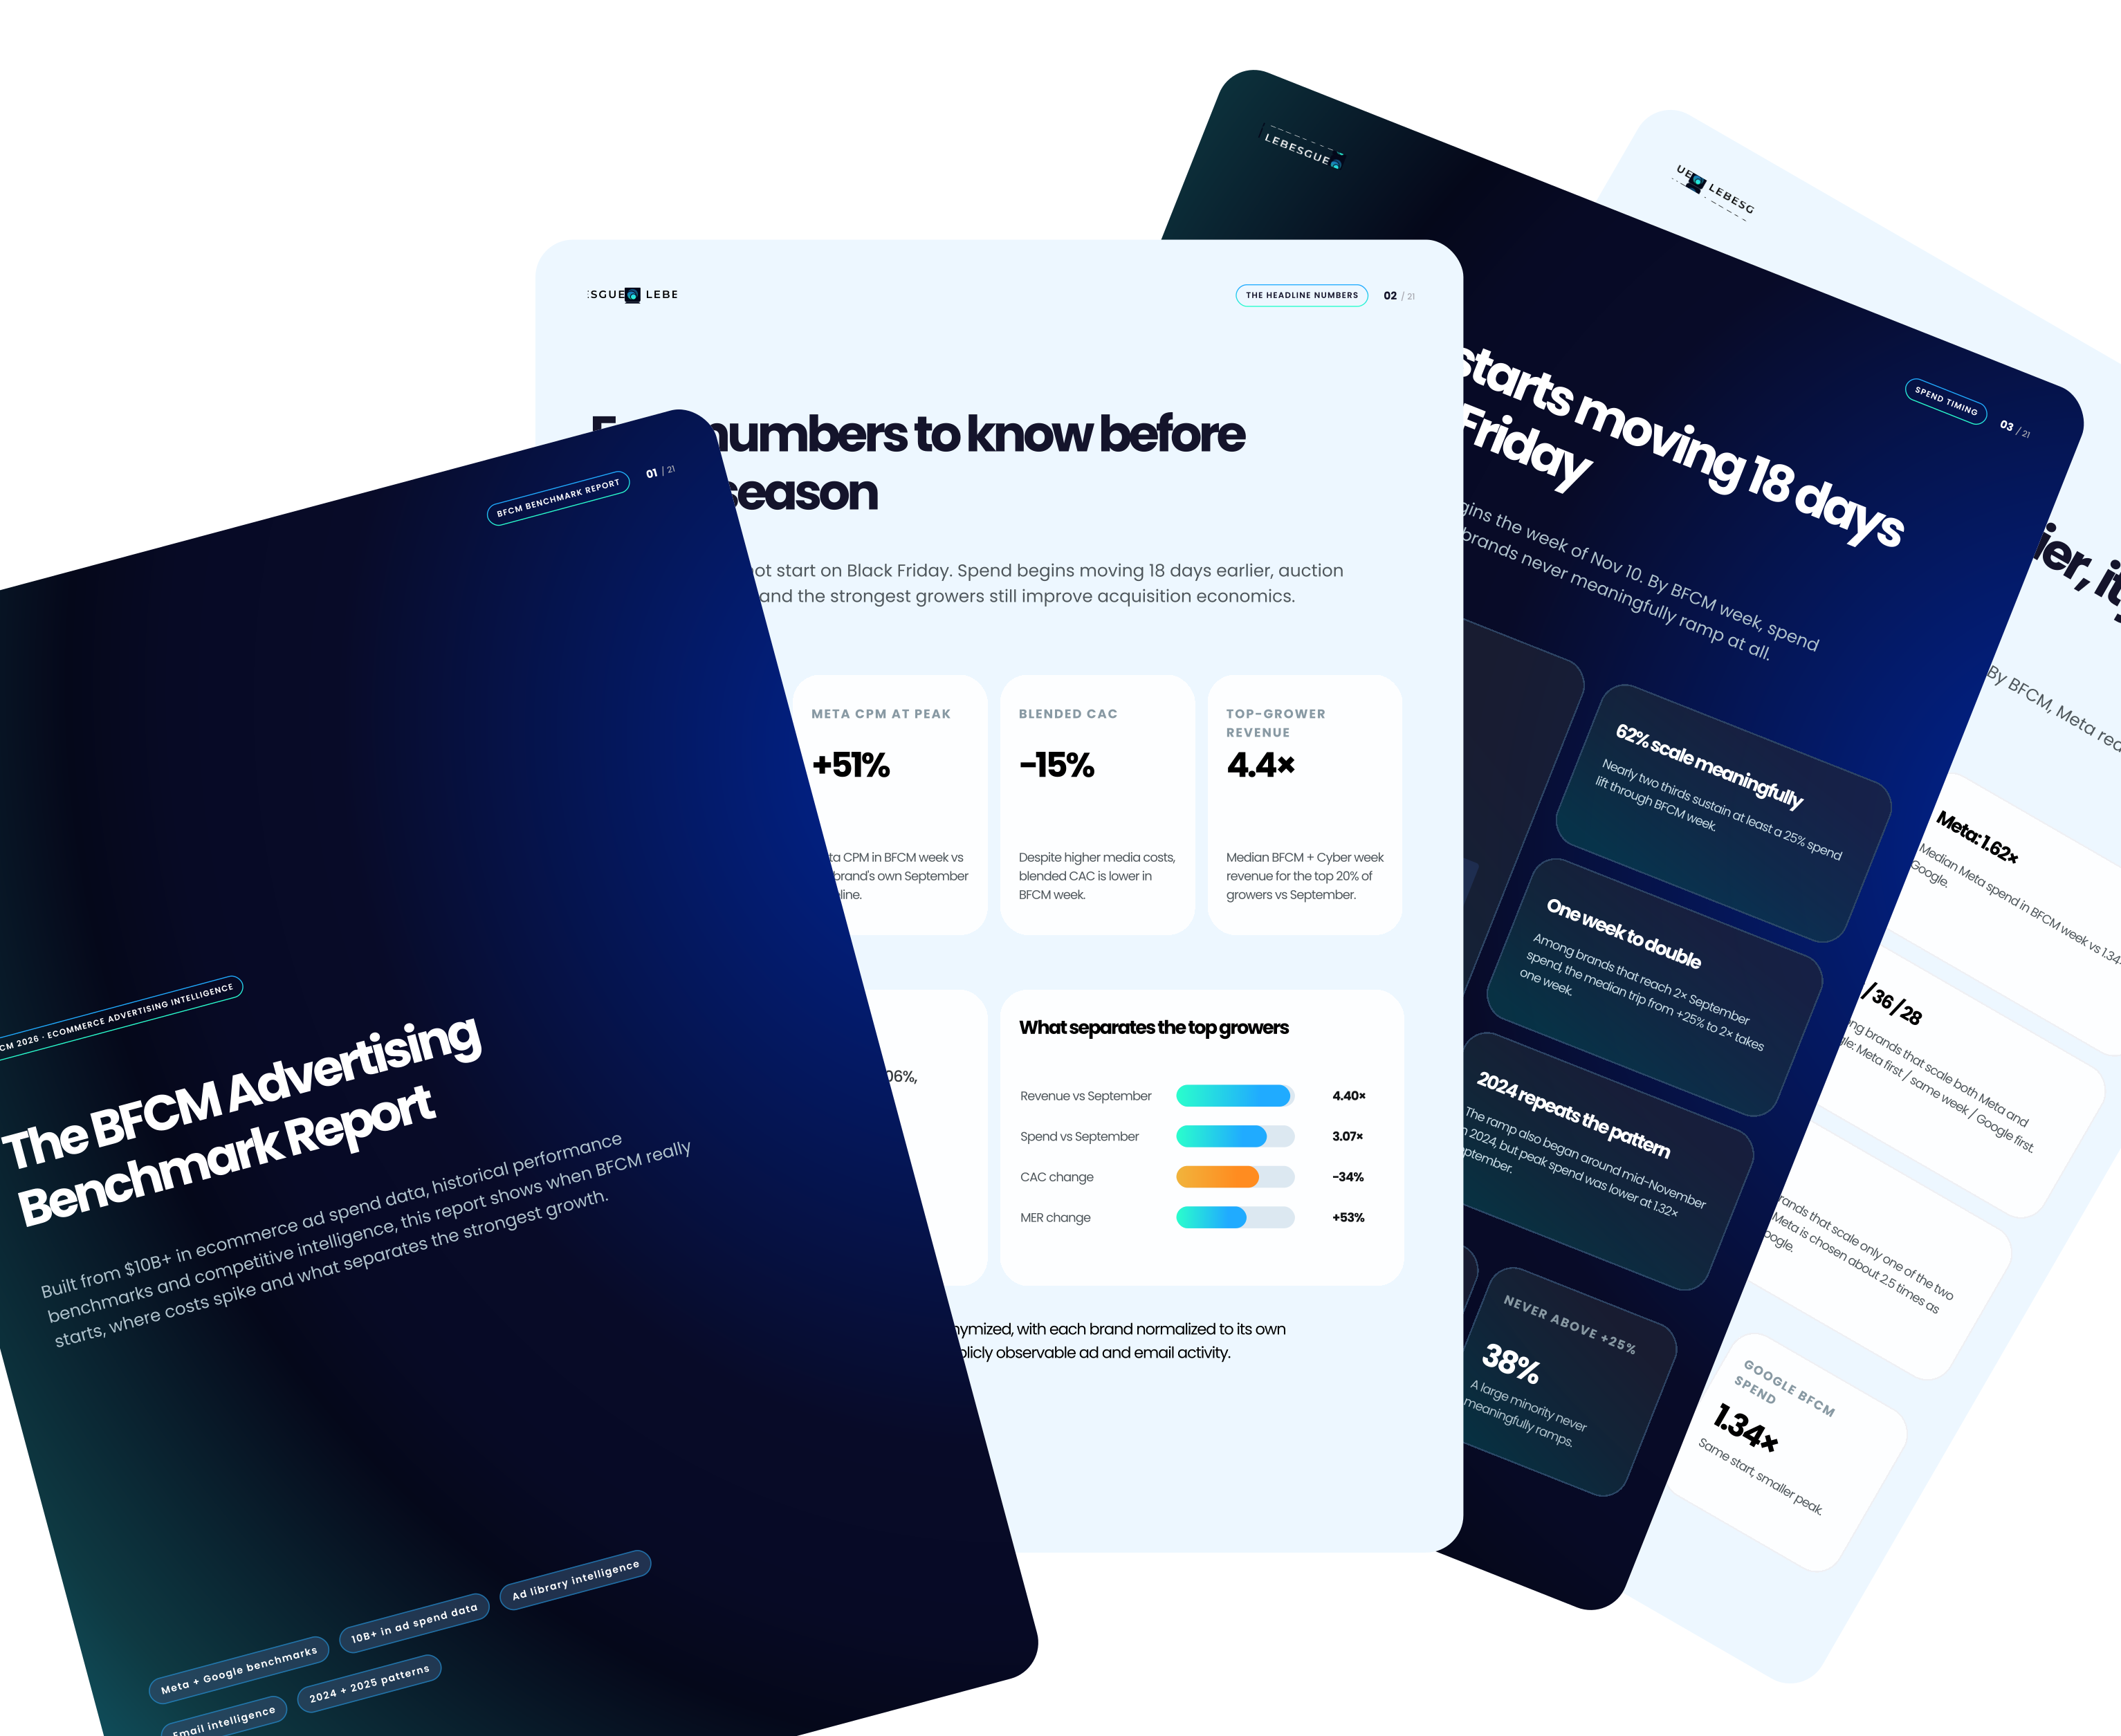
In this free report, find out when to start scaling, how BFCM economics change, and whether your account is telling you to pull back, hold or push harder.
BFCM gets more expensive, but customers get cheaper
Spend starts moving 18 days before Black Friday. By peak week, Meta CPM is 51% above September while blended CAC is 15% lower.
Spend starts moving
18 days
The median sustained paid-media ramp begins well before Black Friday week.
Meta CPM at peak
+51%
The cost of attention jumps sharply as peak demand arrives.
Blended CAC
-15%
Despite higher media costs, customers get cheaper as demand accelerates.
Four questions worth answering before budgets rise
When should you start scaling?
See when spend begins moving and how timing differs by category.
When do higher costs actually matter?
See how CPM, CTR, CPC, CAC and ROAS move as demand and competition intensify.
What do stronger growers do differently?
Compare timing, spend and creative behavior across growth cohorts.
What are competitors doing before you?
Track public ad activity, offer changes and email timing before peak week.
BFCM gets expensive. The real risk is not knowing whether your numbers are actually good.
Start with the market, then make it personal
The report shows what the market did. Lebesgue then helps you understand what that means for your account, where you stand versus peers and what to fix before you scale.
1
Get the report
See when BFCM spend starts moving, how acquisition economics change and what stronger cohorts do differently.
2
Benchmark your brand
Compare your Meta and Google performance with relevant peers to see whether your numbers are actually competitive.
3
Get a personalized review
We review your account, benchmark context and competitors to show where you can scale and what we would fix first.
Get the BFCM benchmark report
See when to start scaling, how acquisition economics change, what stronger growers do differently and how competitors prepare before peak week.
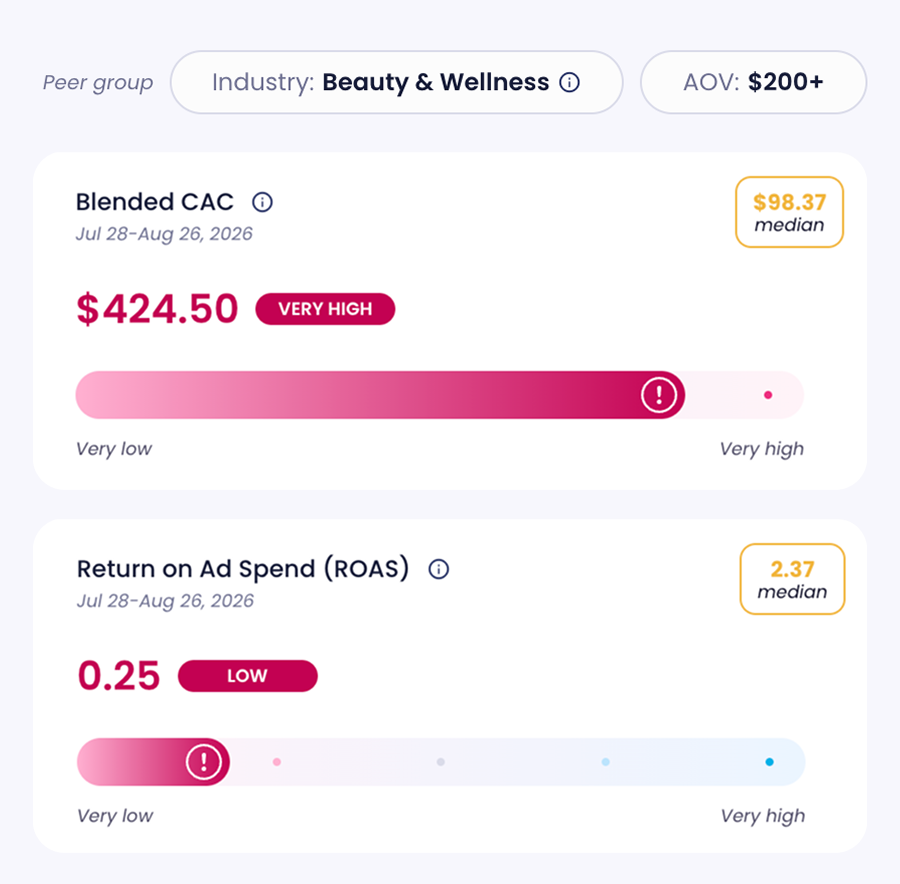
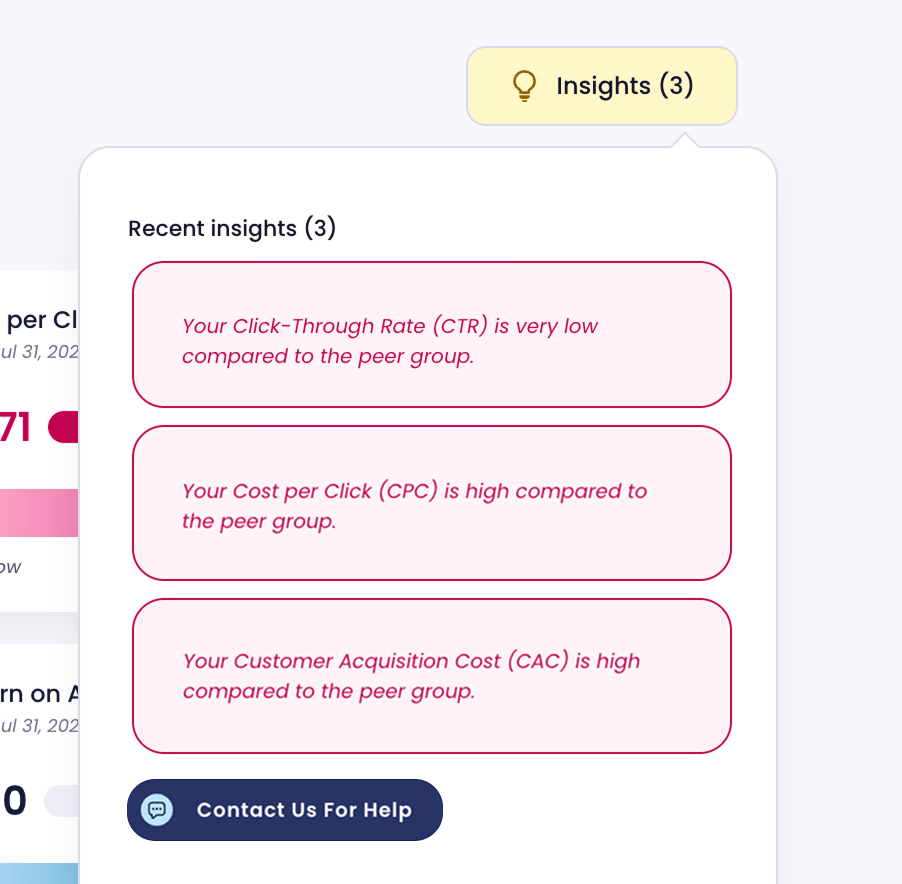
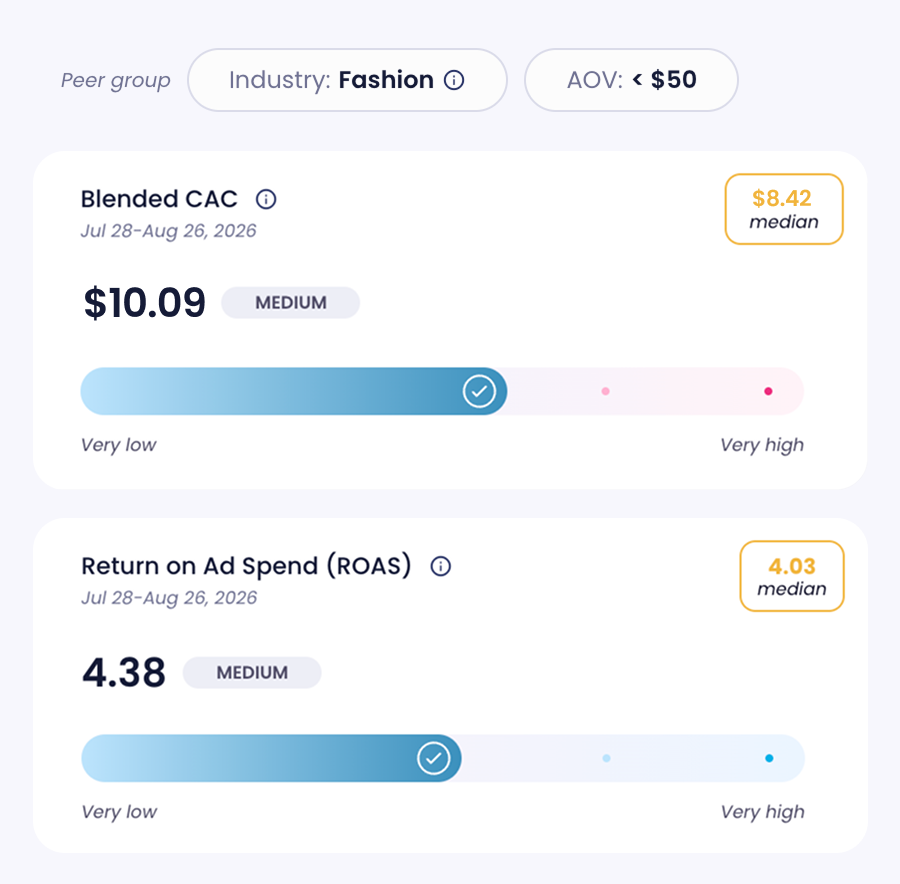
Are your numbers actually good?
Benchmark your account against relevant peers to see what’s normal, what’s not, and where your performance needs attention.
ROAS — Fashion, <$50 AOV
ROAS — Beauty & Wellness, $200+ AOV
What this means for your target
10 personalized reviews available
Is your account actually ready to scale?
We turn the report into a personalized action plan for your account, showing where you can scale and what to fix first.
Your personalized BFCM review
Meta and Google performance vs relevant peers
Account issues that may be wasting budget
Competitor BFCM activity and messaging context
What we would fix before increasing spend
About the BFCM benchmark report
The report covers spend timing, media costs, conversion economics, creative velocity, industry differences, competitor ad activity, offer changes and email cadence before Black Friday.
Performance benchmarks are based on aggregated and anonymized ecommerce data. Named competitor examples use publicly observable ad-library and marketing-email activity.
You get access to the full report. If you want the next layer, you can benchmark your own brand in Lebesgue or request one of the personalized BFCM reviews.
The Lebesgue team reviews your paid media performance, peer benchmarks, account setup and competitor context before the session, then prepares the areas we would prioritize before you scale.
Each review includes manual preparation by a Lebesgue team member, so the number of available BFCM review spots is intentionally limited.