Amazon LTV & Cohort Analysis for Sellers
Connect your Amazon Seller Account to Lebesgue and get automated cohort reports.
Lebesgue’s Amazon LTV feature helps you see how your customers reorder, repurchase, and generate revenue over time. Instantly turn your Amazon data into live cohort reports in Google Sheets — simple, automated, and built to help you grow smarter.
How Lebesgue Turns Your Amazon Data Into Cohort Insights
1
Connect Your Amazon Seller Account
Easily connect one or more Amazon Seller Accounts to Lebesgue with our seamless 1-click integration — alongside other platforms like Shopify and WooCommerce. Once connected, Lebesgue automatically pulls your data so you can view performance metrics directly inside your dashboard.

2
We Set Up Your Google Sheet
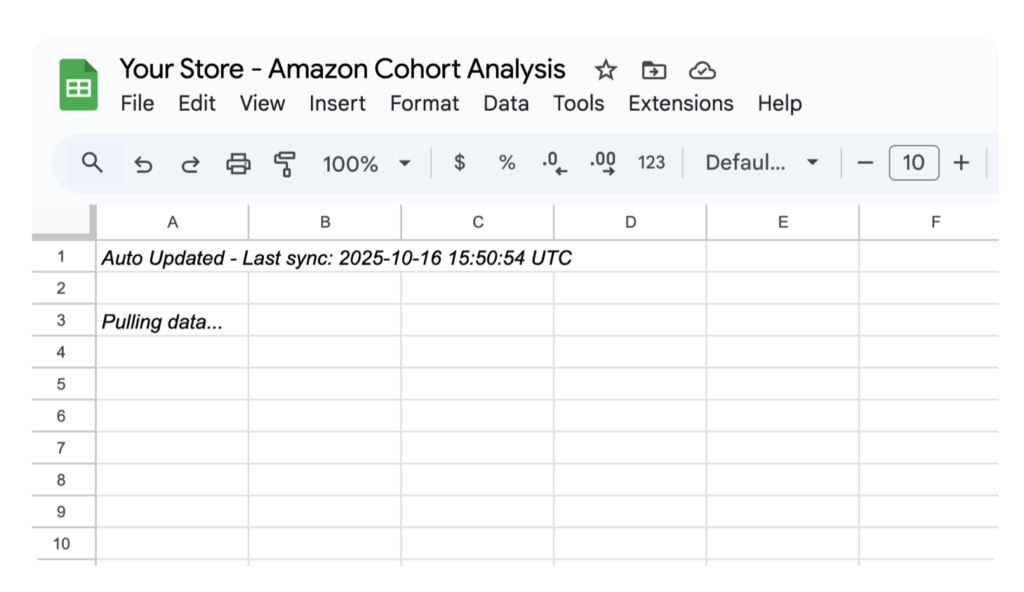
To enable the Amazon LTV feature, simply reach out to our team. We’ll set up your personalized Google Sheet for you and activate automatic updates so your data stays fresh without any manual work.
3
Receive Your Regular LTV Report
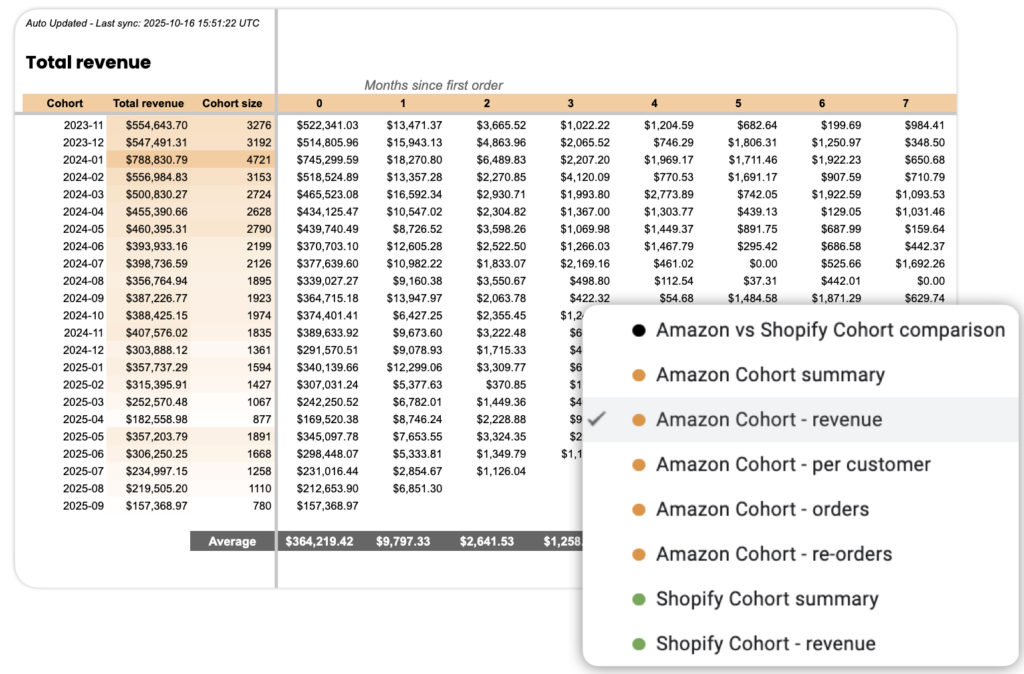
Your Google Sheet becomes your live report, automatically updated with Amazon cohort data. Analyze how customer revenue, reorders, and user behavior evolve over time and even compare Amazon performance with your Shopify or WooCommerce cohorts to get the full picture of your business growth.
How Lebesgue Amazon LTV & Cohort Analysis Helps You
Lebesgue takes away the guesswork. No more exporting data or stitching together spreadsheets to understand how your Amazon business performs over time. Instead, get clear, automated visibility into how your orders, revenue, and reorders evolve - fast, effortless, and built to help your store grow sustainably.
1
Understand Your Customer Retention Trends
See how groups of customers reorder and generate revenue over time. Lebesgue visualizes your Amazon cohorts so you can spot which months or campaigns bring in customers who keep buying and which don’t.
2
Move Beyond Single Sales to Sustainable Growth
Stop optimizing only for today’s order volume. Lebesgue helps you understand long-term revenue behavior across cohorts, so you can focus on improving repeat purchase rates and building lasting profitability.
3
Make sense of your data without drowning in complexity
You don’t need to become a data scientist. Your Amazon data automatically pulls into a Google Sheet, updates itself, and gives you what you need without manual exports or awkward pivots.
4
Compare your Amazon performance with YOUR STORE DATA
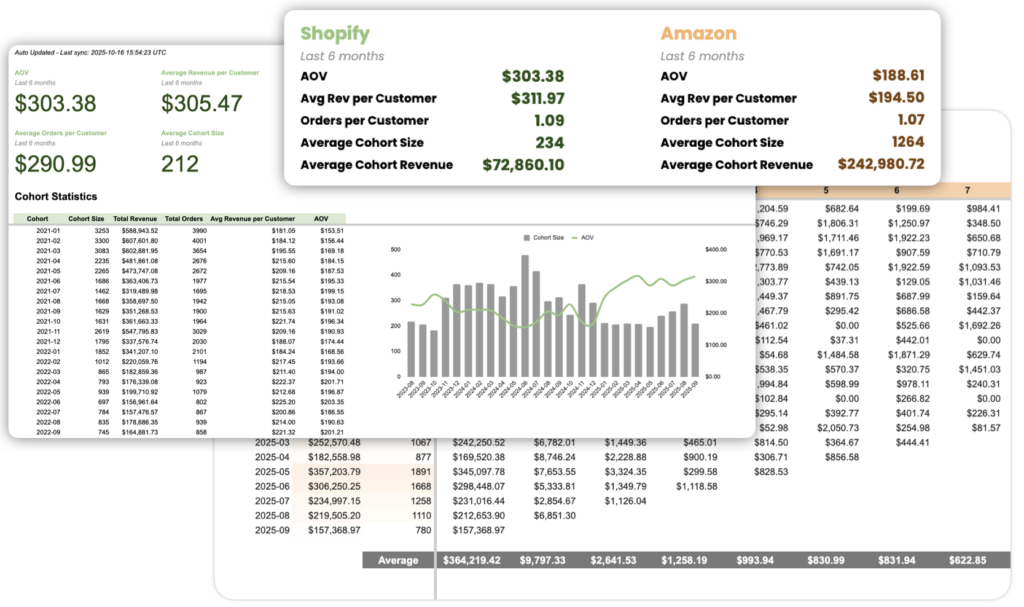
If you sell on Amazon and Shopify or WooCommerce, you can see how Amazon cohorts stack up versus other channels, helping you decide where to invest and what’s really working.
5
Optimise your marketing and investment based on real value
Instead of budgeting ads blindly, you’ll know which customers are worth acquiring and how much you can afford to spend based on their lifetime value. That means smarter ad spend, better retention, and improved profitability.
Add Your Heading Text Here
Add Your Heading Text Here
10,000+
Shopify brands trust Lebesgue to enhance their marketing.
Join them and start making better marketing decisions.
I am obsessed with Lebesgue. I check it three times a day/run reports personally as a CEO and have my entire marketing team and even ops looking at the stats and information provided. The app is affordable and the AI features have really improved as the Lebesgue team is constantly making updates. I love that I can see all paid media, email, amazon, tik tok, Pinterest, and shop data all in one place as well as competition info
Lebesgue has completely transformed our PPC strategy — in ways we didn’t even know were possible. Before working with them, we thought we had a solid handle on paid ads. But their statistical expertise, data-driven precision, and strategic insight took everything to another level.
Helps us understand LTVs and customer cohorts in an easy to visualize manner. We like Lebesgue as it easily hooks up with Shopify, and we can have clients pull up important data with it.
Lebesgue: Amazon Ads
Verified Partner
Turn Amazon Data Into Clarity
Automated LTV and cohort analysis for sellers who want to scale smarter.
Connect your Amazon Seller Account to Lebesgue and start seeing how your store’s performance evolves over time - no manual setup, just simple, actionable insights.
Frequently Asked Questions about Amazon LTV & Cohort report
Amazon doesn’t give sellers full visibility into customer-level purchase history – but Lebesgue does the heavy lifting for you.
By connecting your Amazon Seller Account, Lebesgue automatically analyzes your sales and order data to create cohort-based LTV reports. This lets you see how your customers reorder, how revenue grows over time, and what your long-term value looks like.
The Amazon LTV feature helps you understand how your Amazon revenue and reorders evolve over time. It transforms your sales data into cohort-based reports, so you can easily see repurchase rates, trends in customer behavior, and long-term store performance.
You can view cohort reports based on orders, revenue, or customers, along with a cohort summary that provides an overview of your store’s retention and growth over time.
The feature isn’t activated by default. To get access, just enter your email in the form on this page and click “Request Access to Amazon LTV.” Our team will reach out to set up your Google Sheet and enable automatic data updates for your account.
Yes. You’ll need to connect your Amazon Seller Account to Lebesgue. Once connected, your data will automatically flow into the app and your LTV report, no manual exports required.
Your reports are shared via Google Sheets for simplicity and easy access. They update automatically, so you’ll always have the latest LTV and cohort data without doing anything manually.
This setup also makes it easy to perform additional analysis, create custom views, or combine the data with your other performance reports – all in a tool you already use every day.
Yes. If you also sell on Shopify or WooCommerce, your Amazon cohorts can be compared side-by-side with your other channels, helping you identify which platform drives the highest customer lifetime value.
Your Google Sheet is automatically refreshed on a regular schedule, ensuring your LTV and cohort data stays up to date without any manual work.
No problem – you can connect multiple Amazon accounts to Lebesgue. The data from each will be included in your reports, giving you a consolidated view of your performance.
Cohort analysis groups your customers based on when they first made a purchase. Instead of looking at overall averages, it shows how each group performs over time – helping you see whether your newer customers are reordering more or less than older ones. It’s one of the best ways to measure retention, repurchase behavior, and long-term growth.