
Whether you call it LTV or cLTV, customer lifetime value is one of the most important metrics for e-commerce businesses. When creating a marketing campaign, each Shopify store owner hopes that their target audience will convert and that they’ll gain new customers. And naturally, they also hope that those customers will keep coming back and re-purchasing their products. But how can they accurately measure and predict how much revenue will those customers bring to their business in the long run? Well, that’s exactly where LTV analysis comes in.
In short, customer lifetime value tells us how much revenue a customer will generate over the entire relationship with a business. This metric not only gives you a better idea of how healthy your current customer base is but it also tells you how likely your company is to grow in the future.
Why is customer LTV analysis important for Shopify stores?
There are many benefits to accurately measuring your customer’s lifetime value. Once measured, this metric can give you answers to questions like “How much should I be spending on customer acquisition and retargeting?”, “Which customers are the most profitable ones for my business?”, or “How much revenue will they bring to my business in the following months?”, etc. All of this information is crucial for you to then make better acquisition and retargeting decisions.
The goal of every e-commerce business is to obviously have a high LTV, which ultimately means that you need to have a strong marketing plan that’s both focused on building trust and retaining your current customer base, but also on prioritizing your most profitable acquisition channels.
How to use cohort analysis to analyze customer LTV
For those of you who are not familiar with our Shopify app, we actually have a feature that’s dedicated to analyzing your customers’ lifetime value. We’ll walk you through all of the parts of the feature so that you can better understand what are its benefits and how you can use it to your advantage.
Before we get into the LTV analysis part, let’s take a look at the first graph below. This graph comes in quite handy when you want to analyze how your revenue changes from month to month over a certain period. But to be fair, you can easily check that in one of your Shopify reports, right? What you can’t do though, is see how much of that revenue has been generated by your first-time (new) customers and how much by repeat customers. And that’s exactly why you’ll love this graph in the Lebesgue app.
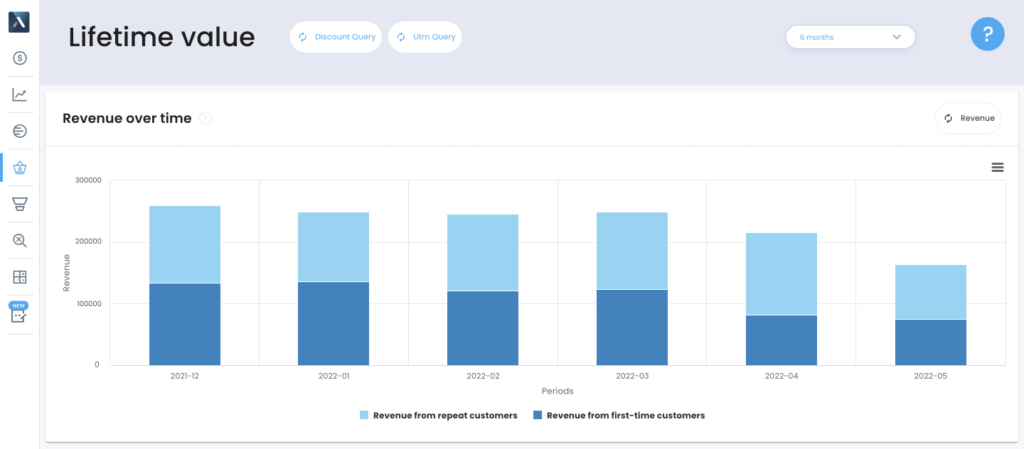
Just by looking at it, you can easily tell how much revenue or orders you’ve generated each month, but more importantly, see which customers are contributing to your revenue growth the most.
⭐⭐⭐⭐⭐
90+ five-star reviews on Shopify App Store
Cohort analysis
Using cohort analysis is crucial if you want to analyze your customer behavior on a deeper level, understand customer churn and improve retention. Cohort analysis allows you to segment your customers into cohorts and then measure each cohort’s behavior over time. Note: A cohort refers to a group of customers who made their first order in a given month.
In the example below, you can see that cohorts are organized by the month of the customer’s first order, and as you can see in the first column, each cohort has its own row. So for example, all the customers that made their first order in January 2022 are put in the January 2022 cohort, as seen on the screenshot below.
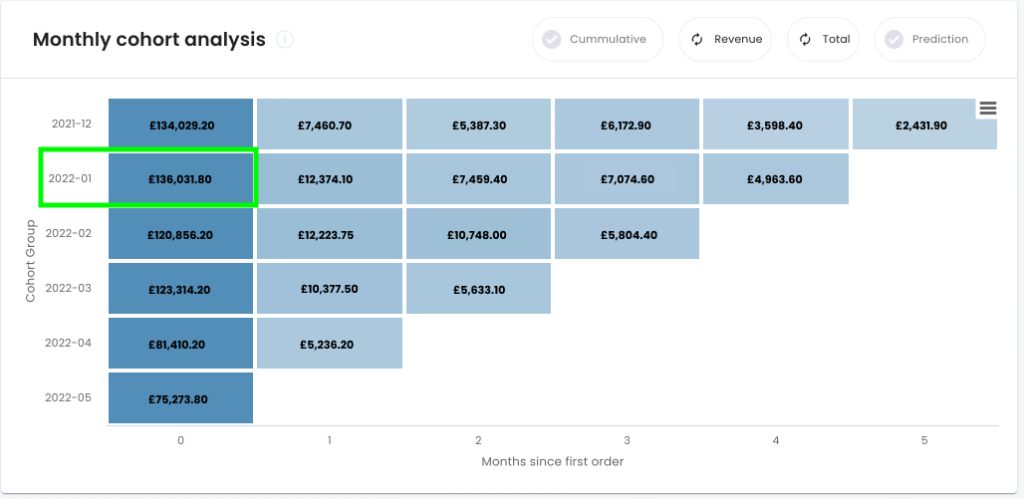
You can see that those customers have brought in £136,031.80 of total revenue, and in the next month (March) they have brought in £12,374.10 of total revenue. If you take another look at the “Revenue over time” graph mentioned earlier, you’ll see that this amount corresponds to the total revenue that has been generated from first-time (new) customers in January.
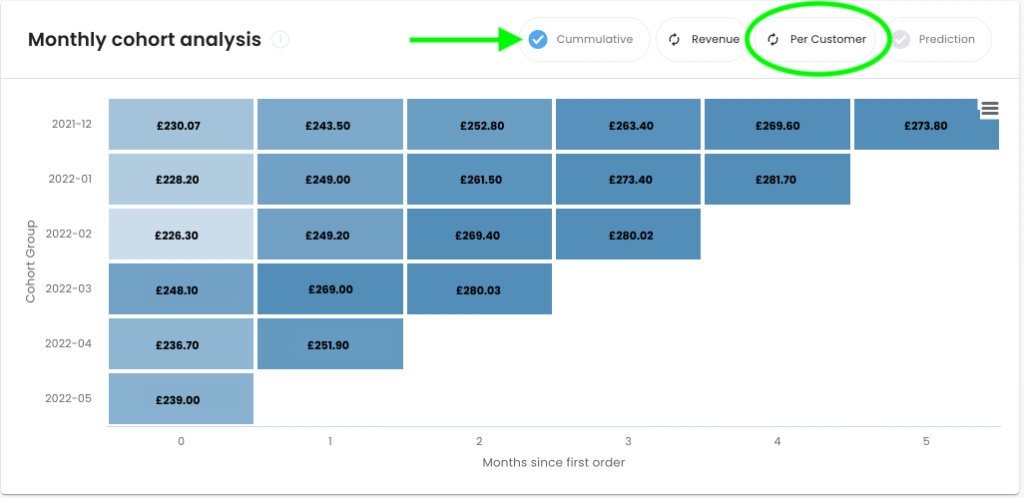
Now, if you’d want to analyze the lifetime value for each cohort, you’ll need to turn on the cumulative option and use the filter “per customer”. Here, we calculate how much an average customer in each cohort is worth to your business in different months. So essentially, we’re taking into calculation the total revenue generated by all customers in each cohort and dividing it by the number of customers in each cohort, i.e. the cohort size.
Can you make future LTV predictions?
With Lebesgue, you sure can. LTV predictions are another core functionality that will help you predict the future value of your customers, i.e. how much revenue they are likely to generate in the future months.
Looking at the cohort table below, you can see that the blue-lined cells in the bottom half are new cohorts for which we’re forecasting the future monthly revenue and orders.
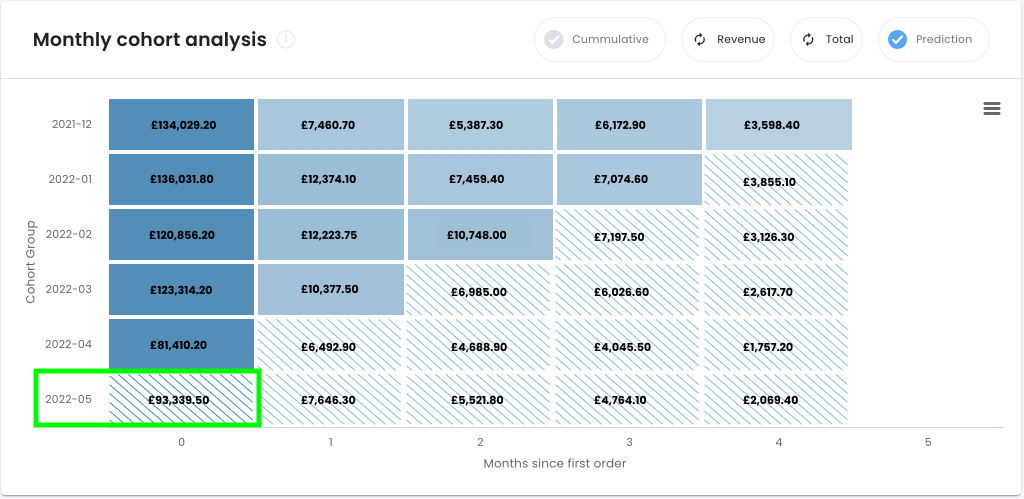
So for example, in May 2022, you can expect £93,339.50 total revenue to be generated by new customers. These customers will then going to generate £7,646.30 in June, £5,521.80 in July, and so on in the next 6 months.
⭐⭐⭐⭐⭐
90+ five-star reviews on Shopify App Store
Cohort statistics
If you’d want to take this a step further and see detailed stats about each cohort, you could also do so within the Lebesgue app. The cohort statistics table gives you an overview of the most important metrics so you can better compare the performance of each cohort. Let’s quickly explain what some of these metrics mean and why they are important.
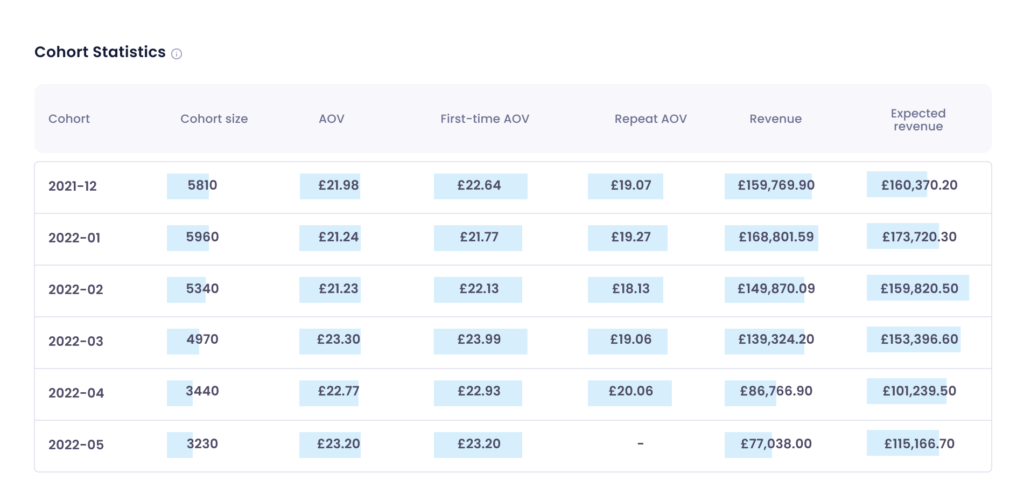
The first column shows the cohort size which represents the total number of customers present in that cohort. So for example, looking at the graph above, we can see that in the January 2022 cohort, there was a total of 5810 acquired customers.
Average order value (AOV)
Those customers had an AOV of £21.91 which is the average order value for all orders they’ve generated over that month. Here we’re taking into consideration both repeat and first-time (new) orders, but if you’d want to look at their AOV separately, you could do so in the next two columns. There you can see that those customers’ first-time AOV was £22.64, while their repeat AOV was £18.69 which tells us that those customers have spent more on their first order than on their second one.
Revenue vs Expected revenue
The revenue column shows us how much revenue has been generated by all customers from a corresponding cohort. Since older cohorts had more time to generate revenue than new ones, it’s better to look at the next column (Expected revenue). In this column, we’re predicting the revenue for more recent cohorts assuming that all the customers from each cohort had equal time (six months, a year or two years) to re-purchase from you. This way you can truly better understand the potential of your newer cohorts and how profitable they can be, given the same amount of time as older ones.
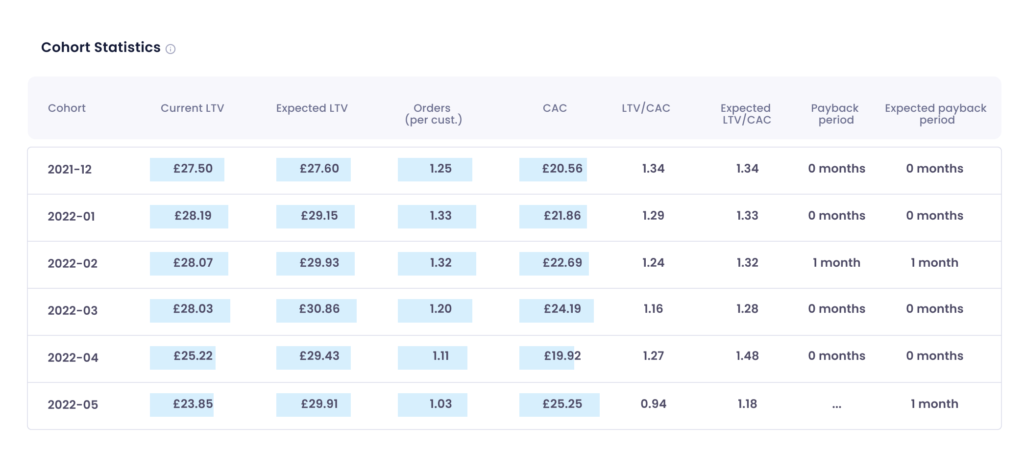
Current LTV
The current LTV column shows you what’s your current LTV per customer. So here we’re dividing the revenue from the corresponding cohort by the size of that cohort. In the expected LTV column, we are also taking into consideration that all of these customers had equal time to repurchase from you and we’re calculating their LTV based on those 6 months.
The orders per customer column shows you how many orders a customer from the corresponding cohort, on average, has placed. Looking at the table and comparing all the cohorts, you can see that older ones have a higher number of orders per customer than new ones, considering that those had more time to repurchase.
Customer Acquisition Cost (CAC)
Most of you probably know what CAC refers to, but in case you don’t, this metric refers to customer acquisition cost which tells you how much you paid to acquire a customer. So looking at the April 2022 cohort, you can see that your CAC was £19.92, while your Firs-time (new) AOV was £22.93. This is what you always want to aim for since you want to be paying less to acquire a new customer than what they will spend over a certain period.
LTV/CAC vs. Expected LTV/CAC
LTV/CAC is a metric that compares your customer’s LTV to the amount of money that you spent acquiring them. If your LTV/CAC ratio is less than 1 it means that you’re paying more to acquire a customer than the value they’re bringing which means that you’re not profitably acquiring customers. So the bottom line is that your LTV/CAC should always ideally be above 1.
The expected LTV/CAC tells you how much more or less you’re likely to make than what you’ve spent on customer acquisition. So for example, looking at May 2022 you can see that you can expect to make 1.24 times what you’ve spent to acquire a new customer from that cohort. Since every acquisition channel is different, so can the expected LTV be so here we suggest you use the UTM filter on the top of the page to analyze the expected LTV across a specific marketing channel.
Similarly, again, the expected payback period refers to the number of months we expect the LTV to recover the CAC.
Payback period vs Expected payback period
The payback period refers to the number of months it takes you to recover the cost of customer acquisition. The goal of every e-commerce business is to keep this period as short as possible in order to grow. Looking at the April 2022 cohort, you can see that the payback period is 0 since we’ve already earned back the amount we spent to acquire a new customer. Meaning, that the first-time AOV is higher than the CAC. we’ve paid back the cost of CAC in the customer’s initial order.
Similarly, again, the expected payback period refers to the number of months we expect the LTV to recover the CAC.
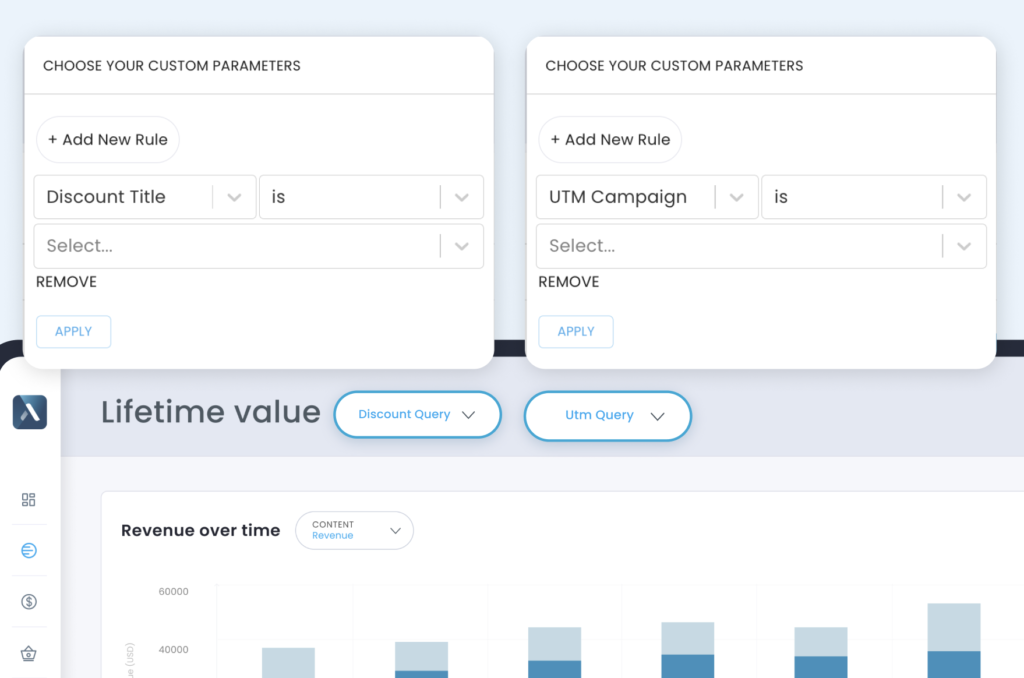
How to analyze customer lifetime value by marketing channel or discount code
Every marketing channel is different. And so are the customers that are acquired through them. For example, customers acquired through Facebook ads may have a higher LTV than the ones acquired through Google ads. Therefore, it’s crucial to break down and analyze your customer lifetime value by marketing channel. The idea essentially is to find the channels that have the lowest customer acquisition cost and the highest customer LTV and then prioritize them moving forward.
When comparing different cohorts, it’s also interesting to analyze how different kinds of discounts/promotions impact customer behavior and LTV. Luckily, you don’t have to crunch numbers and spend thousands of hours to find that out. Thanks to our UTM and discount filter, you can quickly analyze and compare customers that were acquired through a certain channel or have purchased a product using a specific discount code.
Conclusion
There are certainly many more metrics you need to keep track of to better understand and grow your Shopify business. However, measuring and keeping track of your customers’ lifetime value can certainly help you make smarter decisions and bring better returns on your investments. If you’d like to try the Lifetime Value or any other feature in our app, you can do so within the 14-day free trial. For any questions on your LTV or Shopify store performance, you can always reach out to us by clicking on the button below.
⭐⭐⭐⭐⭐
90+ five-star reviews on Shopify App Store


No comment yet, add your voice below!