In online marketing, we face a choice: go after new customers or reconnect with the ones who know us. But, it’s not just numbers; it’s about how many people recognize your brand. In this blog post, we’ll dive deep into how your advertising budget affects Google searches and shapes how customers remember you. Let’s break down the link between ad spending and brand awareness.
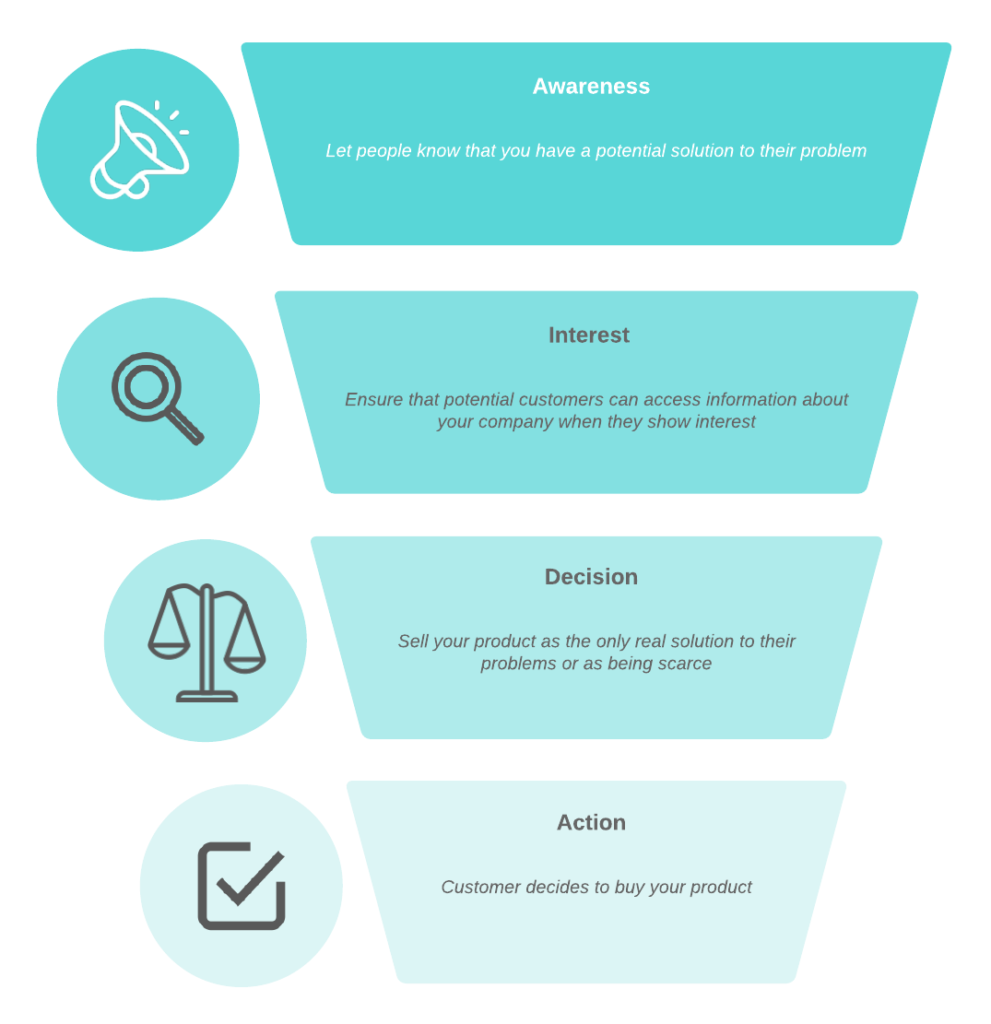
Based on how well a campaign’s target audience is familiar with the product/brand, marketing campaigns can be roughly divided into two groups:
- Prospecting campaigns – targeting potential customers with no prior interactions with the brand,
- Retargeting campaigns – targeting people who are already familiar with the brand to some extent.
When it comes to how much it costs to get a new customer, retargeting ads usually do better. Why?
Because the audience seeing these ads already know the brand. But, here’s the twist—prospecting ads do more than just get sales; they also make more people aware of the brand.
Now, let’s get into the nitty-gritty. Imagine you have only one ad campaign focused on acquiring new customers. We want to check if it’s not just getting sales but also making more people aware of the brand.
So, when we say “brand awareness,” we mean how many times people search for that brand on Google.
Here’s why it matters: If there were 1000 searches for a brand in January and 2000 in February, we can say brand awareness went up. If the searches drop to 500 in February, we’d say brand awareness is lower. This helps us understand what we can control in our experiment:
Independent variable: Daily spend on the acquisition campaign (CS for campaign spend),
Dependent variable: Number of daily searches for the brand on Google (GS for Google Searches).
This sets the stage for our experiment—seeing if the budget spent on ads relates to how often people are searching for the brand.
Analytical Background
Now, we’ll explain some analytical background of our experiment.
We assume the simple linear regression model.
Where b0,b1 are model parameters we need to calculate from historical data. Data for the number of daily brand searches can be acquired from the Google Search Console, and daily spend for the acquisition campaign can be collected from whichever advertising platform is used.
Using the least squares method, the values of parameters can easily be found from historical data. The interpretation of the parameters is very important, so we advise getting familiar with their meaning:
- b1 – the slope of the fitted linear curve: how many additional Google search queries does one additional dollar spend on the acquisition campaign bring,
- b0 – the y-intercept of the fitted linear curve: the number of daily brand Google searches with no spend on the acquisition campaign in question.
Once these parameter values are calculated, we are interested in the following:
- We would like to test if there is any correlation between the independent and dependent variables.
- If we prove that the relationship exists, how can we use it to make predictions?
Proving the correlation
Proving the correlation between two numerical variables means proving that changes in the independent variable (campaign spend) will cause changes in the dependent variable (number of searches). If we take a look at the model once again,
We see that changes in spend will change the number of Google searches if and only if the value of the parameter a is different from zero. In the formal language of statistics, we want to test the following hypothesis:
Measuring brand awareness
Suppose the sample provided was sufficient to prove that the slope of the line is not equal to zero, and let’s say that the slope was calculated to be b1=0.1.
Once more, the interpretation of this figure is that 1000 additional dollars spent on the campaign will bring 100 additional searches on Google. Scaling this up, we get that $1000 additional dollars spent on the campaign will bring 100 additional Google searches.
To get from Google searches to purchases, two metrics are required: CTR for the brand keywords and the conversion rate for the same keywords. CTR can be found in the Google Search Console, and CR in Google Analytics.
If these two tools are linked together, then all of the data can be read in Google Analytics. Assuming that the CTR for the brand keywords is around 45%, and that the conversion rate for the brand keyword is 10%, these 100 additional Google Searches amount to 45 additional website visitors and 4.5 additional organic purchases.
Conclusion
The above-described method represents a starting point for analyzing the impact of individual acquisition channels on the amount of organic traffic. There are a number of ways the model can be improved upon:
- Selecting more than one organic keyword,
- Analyzing more campaigns at the same time, as it’s not a reasonable assumption that only one acquisition campaign/channel is active (this brings up the topic of multilinear regression),
- Using time series to analyze data. In our calculations, the temporal component of the data was lost, and we treated each data point as independent from other data points, which may not be the case.
This article serves as a way of starting to think about how different traffic sources are related, and in the next article, we will start to fix the mentioned model deficiencies and start to build a better understanding of how brand awareness is spread.
⭐⭐⭐⭐⭐
100+ five-star reviews on Shopify App Store
to get free advertising optimization tips and exclusive insights




No comment yet, add your voice below!